How to analyse urban potential: a practical guide

Urban potential analysis is the structured process of evaluating spatial, regulatory, environmental, and financial factors to identify and prioritise development opportunities within a city or site. Knowing how to analyze urban potential is a core competency for urban planners, real estate investors, and local government officials who need to make confident, evidence-based decisions. The process draws on GIS data, 3D city models, zoning classifications, sunlight and visibility analysis, risk frameworks, and financial metrics such as Net Present Value (NPV). Platforms like 3D Cityplanner bring these layers together in a single browser-based environment, making site evaluation faster and more transparent from the earliest feasibility stage.
What are the key criteria for assessing urban development potential?
Urban potential assessment begins with defining the measurable factors that determine whether a site can support development, and at what scale. These factors span physical, regulatory, environmental, and financial dimensions.
Location and land use zoning set the legal ceiling for what can be built. Zoning classifications define permitted uses, maximum floor area ratios, building heights, and setback requirements. A site zoned for mixed use in a transit corridor carries fundamentally different potential from an industrial plot on the urban fringe.

Building density and volume translate zoning permissions into spatial reality. Calculating gross floor area, plot ratio, and building massing against site constraints tells you how much development is physically achievable. Tools that model building volumes in 3D make this calculation visible and testable before any design work begins.
The following factors round out a complete urban potential assessment:
- Infrastructure accessibility: proximity to public transport, road capacity, parking provision, and utility connections
- Environmental quality: sunlight exposure across proposed building faces and public spaces, greenery coverage, and the quality of surrounding public realm
- Visibility and urban form: sightlines, street frontage, and how a proposed development integrates with the existing townscape
- Risk and constraints: flood zones, landslide hazard areas, contaminated land, heritage designations, and other development restrictions
- Financial feasibility: metrics including NPV, Internal Rate of Return (IRR), and Benefit–Cost ratio to confirm economic viability alongside physical suitability
Multi-dimensional evaluation frameworks combine these financial metrics with social and environmental criteria assessed against a no-development baseline. This prevents any single indicator from dominating the decision.
Pro Tip: Validate your spatial data against at least two independent sources before weighting any indicator. Outdated cadastral records or misclassified land use polygons are among the most common causes of flawed site assessments.
How to analyse urban potential: a step-by-step workflow
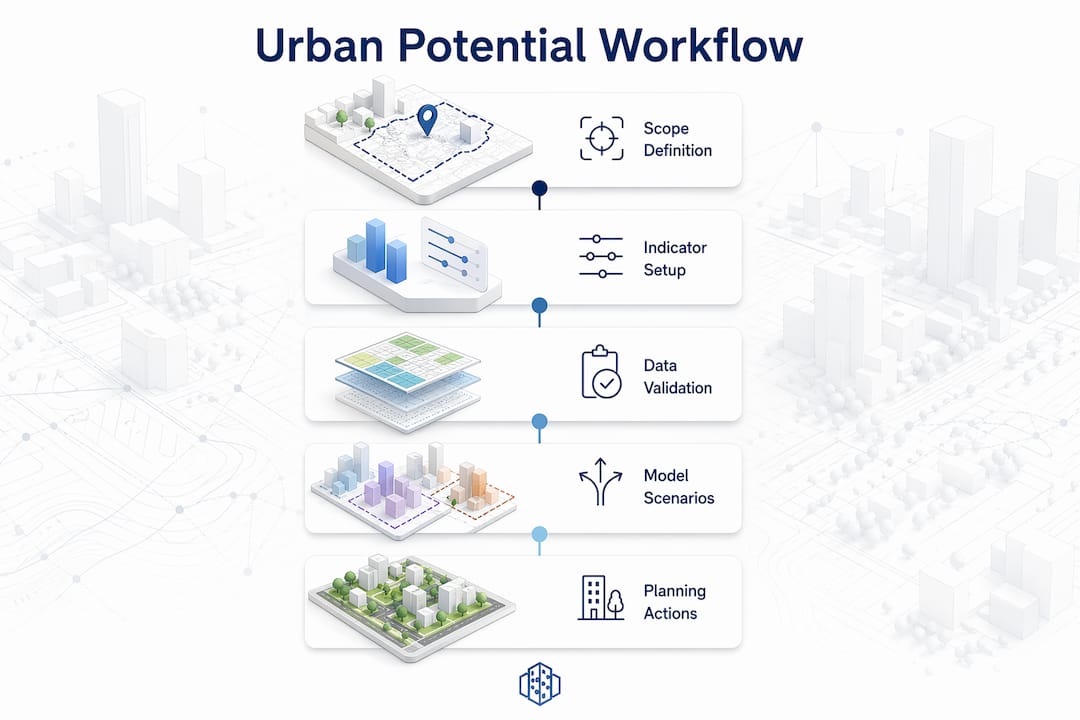
Professionals follow a consistent four-stage process when conducting urban potential analysis. Urban potential assessment is typically structured as an evidence pipeline: define scope and indicators, collect and validate data, model and simulate scenarios, then interpret and prioritise outputs. Each stage builds on the last, and skipping any step introduces risk into the final recommendation.
- Define scope and indicators. Agree on the geographic boundary, the development objectives, and the specific indicators you will measure. For a brownfield regeneration project, this might include contamination risk, existing infrastructure capacity, and target residential density. For a commercial site, footfall potential and visibility from key routes may rank higher.
- Collect and validate data. Gather spatial datasets, socio-economic statistics, zoning maps, hazard layers, and infrastructure records. Cross-check sources for currency and consistency. A tiered assessment approach uses rapid GIS-based screening first, reserving resource-intensive field surveys and detailed hazard studies for the highest-priority sites. This optimises time and budget without sacrificing rigour.
- Model and simulate scenarios. Apply GIS overlay analysis, 3D city modelling, and digital twin simulation to test alternative development configurations. This stage is where building volumes, sunlight, parking, and public space are modelled spatially. Scenario comparison at this point reveals trade-offs that are invisible in spreadsheet analysis alone.
- Interpret and prioritise outputs. Translate model outputs into ranked site classifications or development recommendations. Multi-Criteria Evaluation (MCE) methods, combining Analytic Hierarchy Process (AHP) weighting with objective entropy weighting, produce balanced scores across technical, environmental, and socio-economic dimensions.
| Stage | Primary Activity | Key Output |
|---|---|---|
| Scope definition | Set indicators and boundaries | Indicator framework |
| Data collection | GIS layers, field surveys, hazard maps | Validated dataset |
| Modelling | Scenario simulation, 3D massing | Comparative scenario models |
| Interpretation | MCE scoring, priority ranking | Site suitability classification |
The World Bank’s Restrict–Condition–Promote (RCP) framework adds a critical layer to stage four. Risk-informed planning restricts development in hazard areas, applies conditions to marginal zones, and actively promotes growth in safer locations. This logic should be embedded into zoning and development control decisions, not treated as a separate scoring exercise.
Pro Tip: Run your GIS screening on all candidate sites before committing to detailed field assessment. One study found that very high suitability zones covered only 21.52% of a study area, meaning the majority of sites can be deprioritised early, saving significant resources.
Which tools support effective urban potential analysis?
The quality of an urban potential assessment depends directly on the tools used to collect, process, and visualise data. The right combination reduces manual error, speeds up scenario testing, and produces outputs that stakeholders can actually interpret.
GIS platforms remain the foundation of spatial analysis. They integrate land use maps, infrastructure layers, demographic data, and hazard zones into a single spatial framework. ArcGIS and QGIS are the most widely used options for overlay analysis, buffer calculations, and suitability mapping.
3D city modelling and digital twin platforms add a dimension that GIS alone cannot provide. 3D Cityplanner is a browser-based platform that enables planners and developers to design, analyse, and compare spatial development scenarios in three dimensions. It models building volumes, sunlight exposure, greenery, parking, visibility, and development capacity within the same environment. This makes it particularly useful for early-stage feasibility studies, where testing multiple massing options quickly can save weeks of design iteration.
The table below compares the primary tool categories by function:
| Tool Category | Primary Function | Typical Use Case |
|---|---|---|
| GIS software (ArcGIS, QGIS) | Spatial data integration and overlay | Site screening, zoning mapping |
| 3D digital twin platforms | Scenario simulation and 3D visualisation | Massing, sunlight, density testing |
| MCE decision support systems | Weighted multi-criteria scoring | Site ranking and prioritisation |
| Remote sensing tools | Land cover and change detection | Greenery, impervious surface mapping |
Decision support systems incorporating MCE functionality allow planners to apply AHP and entropy weighting to indicator sets, producing transparent, auditable scores. This is particularly important when presenting recommendations to elected officials or investors who need to understand how a conclusion was reached.
The role of spatial data in urban development has grown significantly as datasets have become more granular and accessible. The challenge now is integration: combining datasets from different agencies, at different resolutions, in different formats, without introducing systematic error.
What challenges arise when analysing urban growth potential?
Even well-resourced teams encounter consistent obstacles when conducting urban potential assessments. Recognising these challenges early allows you to design a process that accounts for them.
- Data quality and currency: Cadastral records, zoning maps, and infrastructure datasets are frequently outdated or inconsistent across administrative boundaries. Always document the vintage and source of each dataset and flag where gaps exist.
- Subjective weighting bias: When planners assign weights to indicators manually, personal or institutional preferences can skew results. Combining AHP with entropy weighting reduces this bias by balancing expert judgement with statistically derived indicator importance.
- Risk translation failures: Hazard scores are often calculated but never converted into enforceable planning rules. Risk analytics must be embedded into enforceable planning actions through the RCP framework, not left as advisory scores that development control teams can overlook.
- Competing criteria and stakeholder conflict: Financial viability, social equity, and environmental performance frequently pull in different directions. A transparent scoring framework makes these trade-offs explicit and defensible.
- Communication gaps: Technical outputs such as GIS suitability maps or MCE score tables are difficult for non-specialist stakeholders to interpret. Three-dimensional visualisations and interactive scenario comparisons close this gap more effectively than static reports.
“Urban development strategies benefit from a transparent assessment-to-decision pipeline enabling stakeholders to make objective, strategic decisions under uncertainty.” — Cities Alliance
The most resilient assessments treat stakeholder communication as a design requirement, not an afterthought. Build your output formats around the decisions your audience needs to make.
How to turn assessment results into planning recommendations
Completing the analysis is only half the task. Translating multi-criteria outputs into planning recommendations that decision-makers can act on requires a deliberate synthesis step.
- Classify sites by suitability. Convert MCE scores into discrete categories such as very high, high, moderate, low, and very low suitability. This spatial classification makes priority areas immediately legible on a map and supports targeted densification in the most viable locations.
- Compare alternatives against a baseline. Strong project evaluation always measures proposed scenarios against a no-development option. This baseline comparison makes the financial, social, and environmental value of each alternative explicit and prevents optimism bias from inflating projections.
- Integrate risk-based zoning actions. Where the RCP framework identifies restricted zones, translate these directly into development control overlays. Where conditions apply, specify the mitigation measures required before development can proceed.
- Prepare decision briefs with 3D visualisations. Present findings using 3D city models and scenario comparison views rather than tables alone. Decision-makers at council level or investment committee stage respond more confidently to spatial outputs they can interrogate visually.
- Prioritise infrastructure investment. Assessment results frequently reveal that high-potential sites are constrained by infrastructure deficits. Use the analysis to build a sequenced investment case: which infrastructure upgrades unlock the greatest development value, and in what order.
Pro Tip: When presenting to a planning committee or investment panel, lead with the spatial priority map and the top three sites. Reserve the full MCE scoring table for the technical appendix. Decision-makers need clarity first, detail second.
The urban development workflow that connects assessment to recommendation is where most projects either gain momentum or stall. A well-structured synthesis document, supported by clear 3D visuals and a concise financial summary, gives all parties the shared reference point they need to move forward.
Key takeaways
Effective urban potential analysis requires integrating spatial, financial, environmental, and risk data through a structured four-stage workflow, supported by GIS, MCE methods, and 3D digital twin tools.
| Point | Details |
|---|---|
| Use a four-stage evidence pipeline | Define indicators, validate data, model scenarios, then interpret and prioritise outputs. |
| Combine AHP with entropy weighting | Mixing subjective and objective weighting methods reduces bias in multi-criteria assessments. |
| Embed risk into planning rules | Apply the Restrict–Condition–Promote framework to convert hazard scores into enforceable zoning decisions. |
| Classify sites spatially | Translate MCE scores into suitability categories to make priority areas legible for decision-makers. |
| Compare against a no-development baseline | Evaluating alternatives against a baseline makes financial and social trade-offs explicit and defensible. |
Why data-driven urban analysis changes the quality of decisions
By Anne Dullemond
After working across urban development projects in the Netherlands, the UK, and several other European contexts, the pattern I see most often is this: teams invest heavily in data collection and almost nothing in the synthesis step. The result is a technically credible dataset attached to a recommendation that nobody fully trusts.
The shift I find most significant in current practice is the move from scoring to decision rules. For years, multi-criteria analysis produced ranked lists that planners then interpreted subjectively. The World Bank’s RCP framework represents a more honest approach: risk evidence becomes a binding constraint, not a score that can be averaged away by a strong financial return. That distinction matters enormously when you are making decisions about where thousands of people will live.
The other change worth noting is what 3D digital twins have done to stakeholder conversations. I have sat in planning meetings where a 3D scenario comparison resolved a three-month disagreement in twenty minutes. When a councillor or an investor can rotate a proposed massing model, check sunlight on the adjacent park, and compare two density options side by side, the conversation becomes concrete rather than abstract. That is not a technology benefit. It is a governance benefit.
The uncomfortable truth is that most urban potential assessments still underweight environmental and social criteria relative to financial ones. Not because planners want to, but because NPV and IRR arrive with precise numbers while social impact scores feel approximate. Building transparent, auditable MCE frameworks is the practical answer. When every criterion has a documented weight and a traceable data source, the trade-offs become visible and the decisions become defensible.
— Anne Dullemond
Analyse urban sites faster with 3d cityplanner
3D Cityplanner is a browser-based digital twin platform built specifically for urban potential assessment and scenario planning. It combines GIS data, 3D city models, and automated area generation to let you test building volumes, sunlight, greenery, parking, and visibility in a single environment.
You can design and compare multiple development scenarios side by side, apply zoning constraints, and present findings to stakeholders through interactive 3D visualisations. The platform supports the full assessment workflow, from early-stage feasibility screening through to masterplanning and redevelopment briefs. Explore the urban design platform to see how it fits your next site evaluation project.
FAQ
What is urban potential analysis?
Urban potential analysis is a multi-factor assessment process that evaluates spatial, regulatory, environmental, and financial conditions to determine a site’s suitability and capacity for development. It typically combines GIS data, zoning classifications, risk frameworks, and financial metrics such as NPV and IRR.
What data sources are used in urban potential assessment?
Practitioners use cadastral and zoning maps, infrastructure records, demographic datasets, hazard layers, and remote sensing data. Validating each source for currency and consistency is a prerequisite before any modelling or scoring begins.
How does the restrict–condition–promote framework work in urban planning?
The World Bank’s RCP framework translates hazard risk evidence into three enforceable planning actions: restricting development in high-risk zones, applying mitigation conditions to marginal areas, and actively promoting growth in safer locations. This converts risk scores into binding development control rules rather than advisory guidance.
How do you reduce bias in multi-criteria urban assessments?
Combining AHP (Analytic Hierarchy Process) with objective entropy weighting balances expert judgement against statistically derived indicator importance. This hybrid approach produces more robust and stakeholder-accepted scores than either method used alone.
What is the difference between GIS screening and detailed site assessment?
GIS screening is a rapid, desk-based process that filters all candidate sites against key spatial indicators to identify the highest-priority locations. Detailed site assessment then applies field surveys, hazard modelling, and financial analysis to those shortlisted sites, concentrating resources where they add the most value.