Why simulate urban traffic: a guide for urban planners
Urban traffic simulation is the process of building detailed virtual models of city traffic flows to predict, analyse, and improve traffic performance and safety before any physical changes are made. Planners and researchers use it to answer a question that traditional methods cannot: what will actually happen when we change this junction, add this development, or reroute this corridor? The answer matters because poor traffic decisions cost cities money, time, and lives. This guide explains the core reasons to simulate urban traffic, the metrics it produces, and how it connects to digital twin frameworks and adaptive control technologies shaping modern city planning.
Why simulate urban traffic before committing to design
Urban traffic simulation, known in professional practice as microsimulation or traffic modelling, is the most reliable way to test design proposals without building them. The core argument is simple: failure in a virtual environment costs almost nothing, while failure on a live street costs everything.
Simulation enables assessment of over 20 urban sites in weeks rather than months required for physical pilots. That speed changes the economics of planning entirely. A team can screen a long list of candidate interventions, from junction redesigns to new pedestrian crossings, and carry only the strongest options forward to field testing.
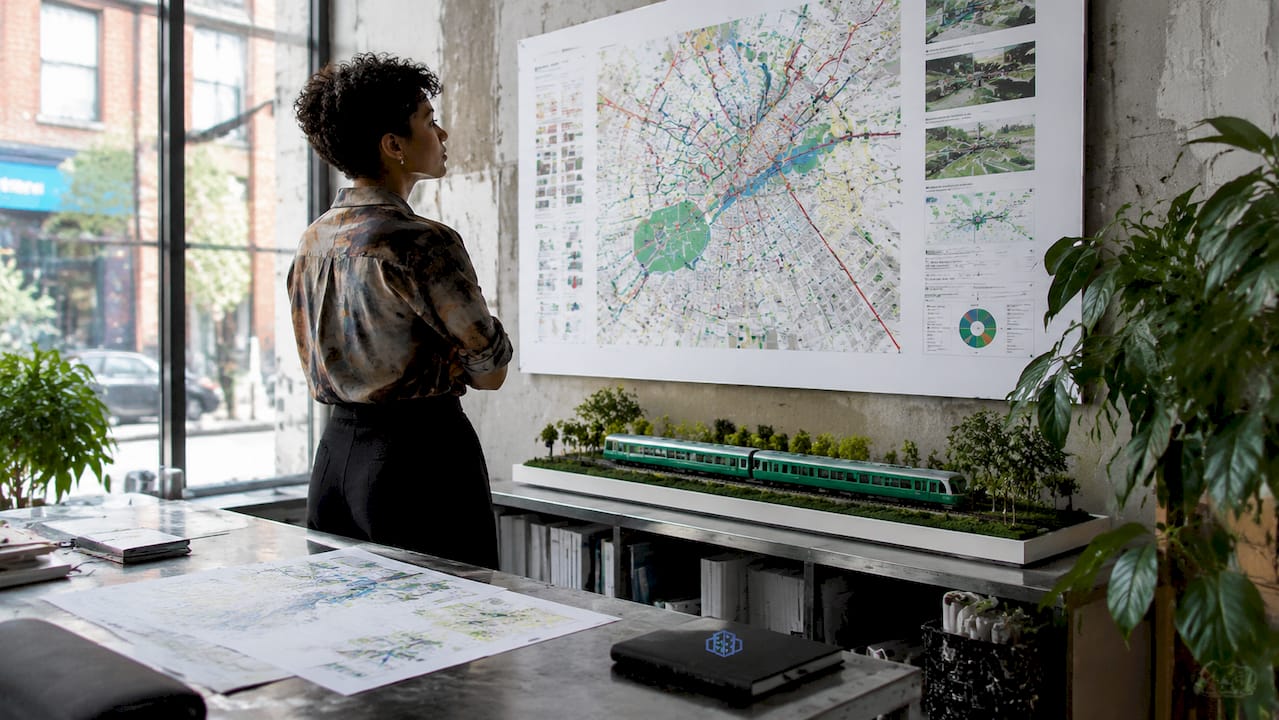
Simulation also acts as a filter. Microsimulation complements physical pilots by prioritising the most promising scenarios before costly on-street trials begin. This means budgets go further and political capital is spent on proposals that already have evidence behind them.
The risk management dimension is equally significant. Behaviourally realistic microsimulation reduces implementation risk and improves safety outcomes. Stakeholders, including elected members, transport authorities, and community groups, respond better to proposals backed by quantified scenario data than to diagrams and professional opinion alone.
- Rapid scenario screening: Test 20 or more design variants in weeks, not months.
- Cost control: Identify failing designs before physical trials consume budget.
- Stakeholder confidence: Present quantified outcomes rather than qualitative assertions.
- Safety pre-assessment: Detect conflict points and failure modes before construction begins.
- Regulatory support: Produce documented evidence for planning submissions and transport assessments.
Pro Tip: Run a minimum of three demand scenarios per site, representing current conditions, a 10-year growth forecast, and a peak stress test. This range exposes designs that perform well today but fail under future pressure.
What metrics does high-fidelity microsimulation produce?
The practical value of traffic modelling lies in the specific, measurable outputs it generates. These are not estimates. They are model-derived figures that planners can present to decision-makers as evidence.
High-fidelity microsimulation quantifies queue lengths, travel times, junction delays, Level of Service ratings, fuel consumption, and CO2 emissions before any scheme is built. Each metric serves a different audience. Engineers use queue lengths and Level of Service to assess capacity. Sustainability officers use fuel and emissions data to evaluate environmental impact. Finance teams use delay costs to calculate economic benefit.
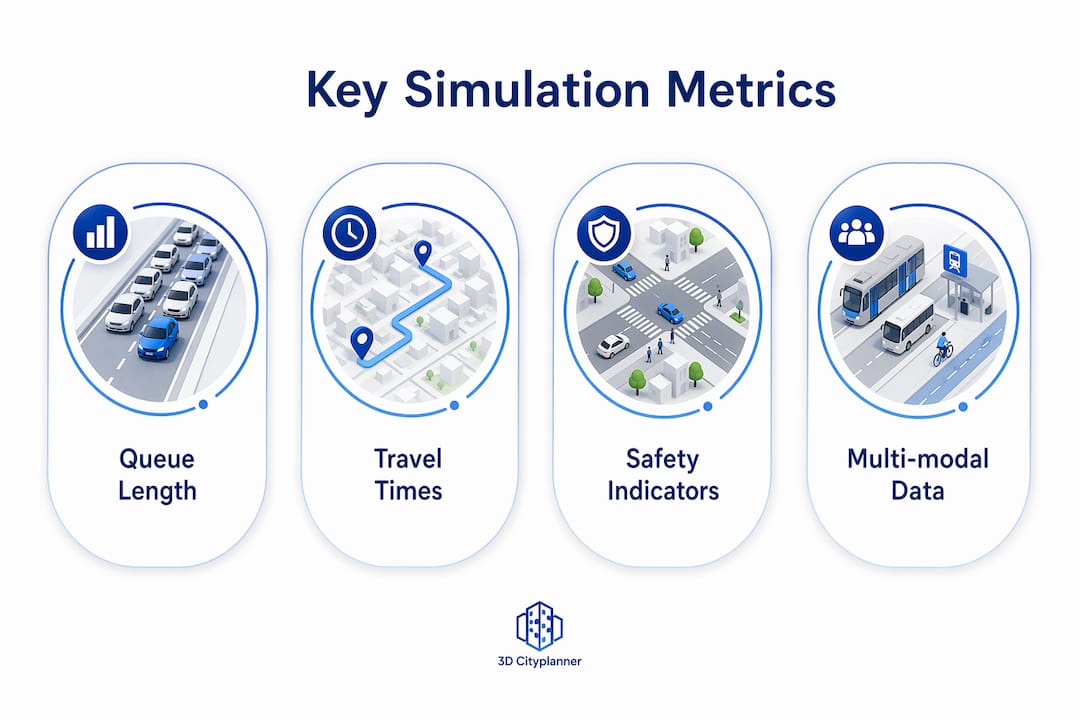
Safety analysis goes beyond capacity metrics. Surrogate safety indicators derived from simulated vehicle and pedestrian trajectories, specifically Time-to-Collision and Post-Encroachment Time, identify high-risk conflict points before any real-world incident occurs. This proactive approach is far more defensible than waiting for collision data to accumulate over years of operation.
Microscopic simulation also models multimodal interactions, including vehicles, cyclists, pedestrians, and public transport, within a single environment. This is critical for urban schemes where different user groups share space and where the safety of the most vulnerable road users depends on how all modes interact.
| Metric | What it measures | Who uses it |
|---|---|---|
| Queue length and spillback | Congestion extent at junctions | Traffic engineers |
| Level of Service (A–F) | Overall junction performance | Planners and transport authorities |
| Time-to-Collision (TTC) | Proximity of near-miss events | Road safety auditors |
| Post-Encroachment Time (PET) | Conflict severity between road users | Safety assessors |
| CO2 and fuel consumption | Environmental impact of traffic flows | Sustainability teams |
| Journey time and delay | Economic cost of congestion | Finance and policy teams |
Pro Tip: Always export trajectory data alongside summary statistics. Trajectory files allow post-processing for surrogate safety analysis using tools like SSAM, which turns simulation outputs into a collision prediction framework.
How does simulation integrate with digital twins and adaptive control?
Traffic simulation is not only a planning tool. It is the technical foundation on which digital twin urban planning frameworks and real-time adaptive control systems are built.
A digital twin in the mobility context is a continuously updated virtual replica of a city’s transport network, fed by live sensor and IoT data. Integrating simulation with digital twin frameworks enables real-time adaptive control algorithms, such as Adaptive Inflow Metering, to reduce traffic system overload dynamically. The shift is from a diagnostic tool, used to understand what happened, to a mitigation tool, used to prevent overload before it occurs.
The practical implications are significant:
- Software-in-the-loop testing: Adaptive control algorithms are tested against simulated traffic before deployment on live networks, eliminating the risk of untested logic causing real congestion.
- Sustainable freight routing: Simulation models urban freight movements alongside passenger traffic, identifying time windows and routes that reduce emissions and conflict with other modes.
- Multimodal integration: Digital twin environments model bus priority, cycle lane interactions, and pedestrian flows simultaneously, supporting integrated mobility planning rather than mode-by-mode analysis.
- Scenario comparison at scale: Planners can compare dozens of signal timing strategies, road pricing schemes, or land use changes within the same digital environment.
Combining simulation with IoT connectivity and AI enables adaptive real-time management that responds to actual network conditions rather than historical averages. Cities that build this capability now are creating infrastructure for traffic management that will remain relevant as autonomous vehicles and shared mobility services reshape demand patterns.
Behavioural calibration and participatory simulation
Simulation accuracy depends entirely on how well the model reflects real human behaviour. A technically sophisticated model built on uncalibrated behavioural parameters will produce plausible-looking but misleading results.
Tuning Wiedemann-74 parameters to reflect local traffic conditions, including narrow lateral clearances, frequent lane changes, and shorter reaction times in dense urban environments, is the difference between a model that validates against observed counts and one that does not. Calibration is not optional. It is the step that determines whether simulation outputs are defensible in a planning inquiry or transport assessment.
A structured calibration process follows these steps:
- Collect baseline data. Gather turning counts, queue observations, journey time surveys, and video footage at the study area. This is your validation dataset.
- Build the network geometry. Code junctions, lane configurations, signal timings, and speed limits from current conditions, not design drawings.
- Set initial behavioural parameters. Apply Wiedemann-74 defaults as a starting point, then adjust standstill distance, headway time, and reaction time to match observed behaviour.
- Run validation scenarios. Compare model outputs against observed queue lengths and journey times. Aim for outputs within an accepted tolerance, typically within 15% of observed counts at key locations.
- Document all assumptions. Record every parameter change and the evidence that justified it. This documentation is essential for peer review and regulatory scrutiny.
- Engage stakeholders in scenario development. Present model outputs to local transport officers, community representatives, and elected members. Their local knowledge often reveals conditions the model has not captured.
The sixth step is frequently skipped, and it is the most consequential. Participatory simulation builds institutional trust and surfaces local knowledge that technical teams miss. Without stakeholder engagement, simulation results risk remaining unused regardless of their technical quality. A model that sits in a report and influences no decision has delivered no value.
Key takeaways
Urban traffic simulation is the most cost-effective method for testing design proposals, quantifying safety risks, and building stakeholder confidence before physical implementation.
| Point | Details |
|---|---|
| Simulation accelerates planning | Over 20 sites can be assessed in weeks, filtering out weak designs before costly field trials. |
| Microsimulation produces actionable metrics | Queue lengths, Level of Service, TTC, and emissions data give each stakeholder group the evidence they need. |
| Calibration determines model credibility | Tuning Wiedemann-74 parameters to local conditions is non-negotiable for defensible outputs. |
| Digital twins extend simulation value | Integrating models with IoT and adaptive control algorithms moves traffic management from reactive to predictive. |
| Participation prevents wasted analysis | Stakeholder engagement turns simulation outputs into decisions rather than archived reports. |
Simulation as strategy, not just analysis
My view, after working across urban planning and digital twin projects, is that most organisations still treat traffic simulation as a technical deliverable rather than a strategic instrument. They commission a model, receive a report, and file it. The real value is never extracted.
The shift I have seen work is treating simulation as a communication platform from day one. When you run a scenario comparison in front of a planning committee rather than presenting a finished report, the conversation changes. Decision-makers ask better questions. Local knowledge surfaces. Assumptions get challenged before they become embedded in a scheme.
The future direction is clear. Full digital twins with real-time actuation, where simulation outputs directly trigger signal changes or variable message signs, are already operating in pilot cities. AI-driven adaptive control will make this the norm within a decade. But the organisations that will benefit most are not those with the most sophisticated models. They are the ones that have built the institutional habit of using simulation evidence to make decisions, rather than to justify decisions already made.
The caution I would add is this: treat simulation as a transparent process, not a black box. Share model assumptions openly. Invite scrutiny. A model that has been challenged and validated in public carries far more weight than one produced behind closed doors, however technically accomplished it may be.
— Anne Dullemond
3D Cityplanner and urban traffic simulation workflows
Urban traffic simulation produces its greatest value when the results are visible, comparable, and easy to communicate across a planning team.
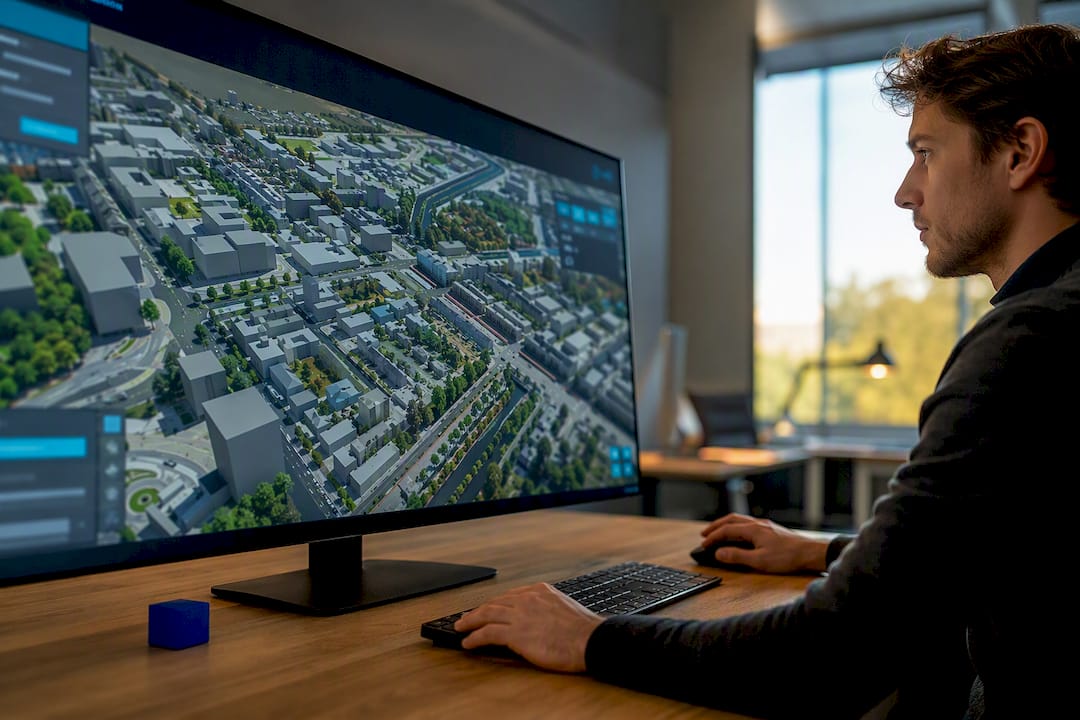
3D Cityplanner is a browser-based digital twin city platform that lets planners design, analyse, and compare spatial development scenarios in 3D, including infrastructure, public space, and transport corridors. It integrates GIS data and 3D city models to support early-stage feasibility studies and masterplanning decisions where traffic and land use interact. Planners can visualise how building massing, road layouts, and public space configurations affect movement patterns, then share those scenarios directly with stakeholders. For teams working on urban traffic simulation projects, 3D Cityplanner provides the spatial context that turns model outputs into decisions.
FAQ
What is urban traffic simulation?
Urban traffic simulation is the virtual modelling of vehicle, pedestrian, and cyclist movements within a city network to predict performance, identify safety risks, and test design interventions before physical implementation.
Why is behavioural calibration necessary in microsimulation?
Uncalibrated models produce outputs that look plausible but do not reflect actual driver behaviour. Tuning parameters such as Wiedemann-74 to local conditions ensures model outputs are defensible in planning assessments and transport inquiries.
What safety metrics does traffic simulation provide?
Microsimulation produces surrogate safety indicators including Time-to-Collision and Post-Encroachment Time, which identify high-risk conflict points between road users before any real-world incidents occur.
How does traffic simulation connect to digital twin technology?
Traffic simulation forms the analytical core of a digital twin, which adds real-time IoT data and adaptive control algorithms to move from static scenario analysis to live traffic management and congestion mitigation.
How many scenarios can simulation assess compared to physical pilots?
Simulation enables assessment of over 20 urban sites in weeks, compared to the months required for traditional physical field pilots, making it a far more efficient method for screening design options.