Optimise city infrastructure with advanced 3D technology

Urban infrastructure is under enormous pressure. Ageing road networks, energy systems that were never designed for modern demand, and flood-prone developments are just a few of the challenges that city planners face every day. The good news is that advanced 3D technology is transforming how professionals approach these problems. Digital twins and 3D city models using technologies like CityGML, BIM, and GIS integration now enable planners to simulate traffic flows, model energy usage, test flood scenarios, and visualise development outcomes before a single brick is laid.
Key Takeaways
| Point | Details |
|---|---|
| Unified 3D modelling | Integrating BIM, GIS, and sensors into CityGML models forms a robust foundation for city planning. |
| Actionable simulations | Digital twins enable planners to test scenarios for traffic, energy, and flooding and make informed decisions. |
| Optimisation algorithms | Multi-objective optimisation helps balance liveability, sustainability, and city growth. |
| Efficient modelling | Using LOD and simplification methods ensures scalability and performance without sacrificing essential features. |
| Stakeholder engagement | Applying sensitivity analysis and Pareto frontiers supports inclusive and transparent urban infrastructure outcomes. |
Essential tools and frameworks for 3D city optimisation
With the challenges established, let us look at the essential digital toolkits and frameworks every planner needs as a foundation. The starting point is understanding three core standards that underpin virtually all modern 3D city work: CityGML, Building Information Modelling (BIM), and Geographic Information Systems (GIS).
CityGML is an open data model and XML-based format for storing and exchanging 3D city models. It captures not just geometry but also the semantic meaning of city features, meaning a building is not simply a shape, it is a structure with attributes like use type, height, and construction date. BIM brings detailed construction and asset information into the equation, while GIS ties everything to real-world geographic coordinates and spatial relationships.
CityGML 3.0 serves as a hub for integrating heterogeneous data from BIM, GIS, and point clouds into semantic 3D streetspace models that include roads, bridges, and tunnels, significantly reducing redundancies across platforms. This interoperability is what makes it possible to build a single, authoritative model of a city rather than dozens of isolated datasets.
Here is a comparison of the three core tools to help you assess your current toolkit:
| Tool | Primary function | Key strength | Ideal use case |
|---|---|---|---|
| CityGML 3.0 | Semantic 3D modelling standard | Interoperability across platforms | City-scale infrastructure modelling |
| BIM | Building-level design and asset data | Detailed construction information | Project design and facility management |
| GIS | Spatial data management | Real-world geographic context | Land use, transport, environmental analysis |
Beyond these standards, the platforms that bring them together matter just as much. Digital twin environments act as living simulation spaces where real-time data feeds into your 3D model, enabling you to test scenarios dynamically rather than relying on static snapshots.
Key capabilities to look for in any 3D city optimisation platform include:
- Automatic building generation from existing GIS data
- Line-of-sight and shadow analysis tools
- Sound and noise propagation simulation
- 4D timeline functionality for phased project planning
- Import support for multiple 3D model formats
- Integration with live sensor and IoT data feeds
For a solid grounding in foundational methods, the guide to 3D urban planning offers a practical starting point, and if you are ready to go further, the resource on advanced 3D strategies covers more sophisticated optimisation techniques.
Pro Tip: When selecting a platform, prioritise native support for CityGML 3.0. It reduces the amount of manual data conversion your team will need to perform and ensures your models remain portable across different tools and agencies.
Integrating data and simulation for actionable insights
Once you have the right tools and standards, the next step is integrating your city’s diverse data streams and leveraging advanced simulations to turn raw data into decisions. This is where the real power of 3D optimisation becomes apparent.

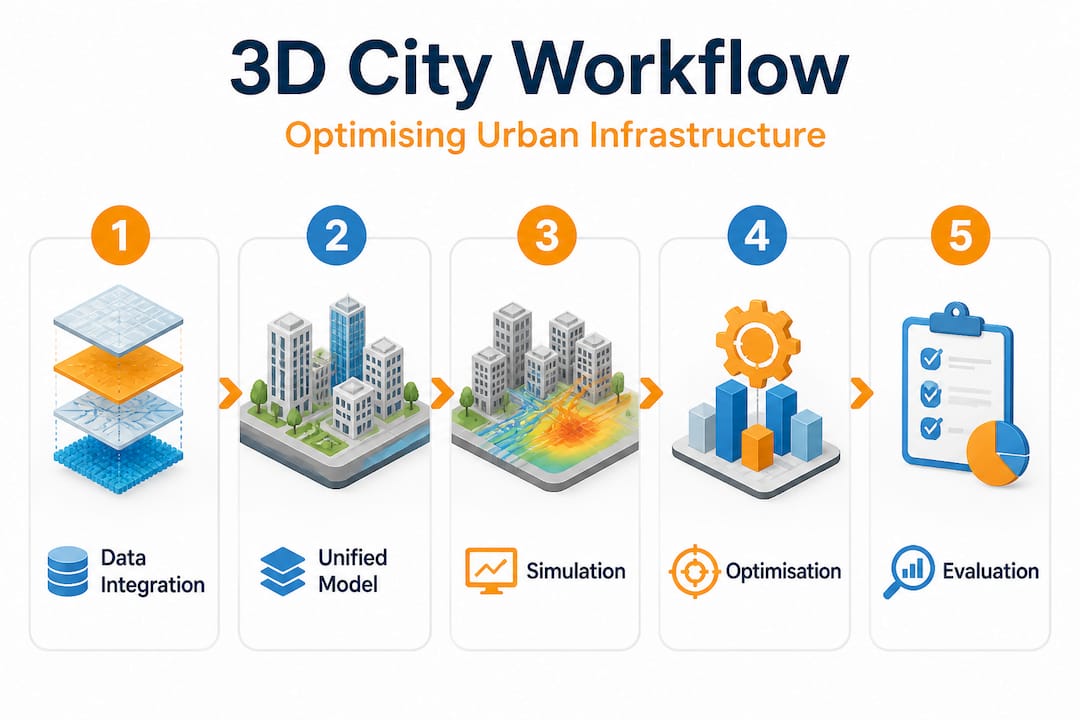
Key methodologies include data integration from GIS, sensors, and BIM into unified 3D models, combined with multi-objective optimisation algorithms to balance liveability, sustainability, and growth, alongside real-time simulations through digital twins. In practice, this means pulling together data from sources that rarely spoke to each other before: transport sensors, utility networks, building energy meters, and environmental monitoring stations.
The impact of digital twins on urban planning has been significant, with cities across Europe and Asia using them to reduce infrastructure costs and improve service delivery. Understanding how to build and sustain this integration is therefore essential for any serious optimisation effort.
| Simulation type | Data inputs | Key output | Planning application |
|---|---|---|---|
| Traffic flow | Road sensors, GPS feeds, land use data | Congestion forecasts | Road design, junction optimisation |
| Flood risk | Rainfall data, terrain models, drainage maps | Inundation maps | Development siting, drainage design |
| Energy demand | Building data, climate data, occupancy patterns | Demand forecasts | Grid planning, retrofit prioritisation |
| Urban heat | Surface cover, tree canopy, building density | Heat island maps | Green space planning, ventilation corridors |
To implement a simulation pipeline effectively, follow these steps:
- Audit your existing data sources. Identify what GIS layers, BIM models, and sensor feeds are available and assess their quality, currency, and format compatibility.
- Establish a unified data schema. Use CityGML 3.0 or a compatible standard to create a common framework so that all data sources can be brought together without losing semantic information.
- Build or connect to your 3D base model. Whether you generate buildings automatically from GIS footprints or import existing BIM models, ensure the base model covers your area of interest at an appropriate Level of Detail (LOD).
- Layer in dynamic data feeds. Connect real-time sensors, transport data, and environmental monitors so your model updates continuously rather than becoming outdated within weeks.
- Run scenario simulations. Test multiple infrastructure configurations against your simulated data, comparing outcomes across metrics like journey time, flood resilience, and energy consumption.
- Document assumptions and sensitivities. Record which variables have the most influence on your results so that decision-makers understand where uncertainty lies.
For a thorough look at how digital twin technology supports this kind of pipeline, and for guidance on project optimisation in 2026, both resources provide detailed practical frameworks.
Pro Tip: Use real-time data updates during scenario testing rather than static snapshots. A model that reflects current conditions will reveal performance differences between scenarios far more reliably than one built on data that is six months old.
Modelling complexity: Balancing detail and performance
Having integrated your data, it is vital to be aware of modelling pitfalls. The temptation is always to build the most detailed model possible, but complexity comes with real costs in terms of processing time, storage, and maintenance.
Geometric complexity in BIM requires simplification through techniques such as the Quadric Error Metrics (QEM) algorithm and LOD hierarchies, while semantic heterogeneity needs to be addressed using Application Domain Extensions (ADEs) or LPG databases, and scalability issues become significant at the city scale. Understanding these constraints is not a sign of technical weakness; it is a professional responsibility.
The Level of Detail (LOD) hierarchy is central to managing this complexity. CityGML defines LOD levels from 0 to 4, where LOD 0 is a simple footprint, LOD 1 is a block model with flat roof, LOD 2 adds roof structure and major features, LOD 3 captures facade details, and LOD 4 includes interior spaces. The key insight is that you rarely need the same LOD across your entire model.
Common challenges and practical solutions include:
- Geometric overload: High-detail BIM exports can contain millions of polygons. Use the QEM algorithm to reduce mesh complexity while preserving the visual and analytical accuracy that matters for your specific use case.
- Semantic gaps: Different data sources use different classification systems. ADEs allow you to extend CityGML’s standard schema to accommodate your local data structures without abandoning the standard altogether.
- Scalability bottlenecks: City-scale models with full LOD 3 detail across hundreds of thousands of buildings will exceed most desktop hardware. Tile your model into manageable chunks and load only what is needed for a given analysis.
- Version control issues: As your model updates, earlier simulation results may no longer be valid. Implement version-controlled model snapshots so you can trace changes and rerun analyses if needed.
“Mesh simplification without careful attention to semantic attributes can strip out precisely the information that makes a model useful for planning decisions. A smoother surface is not always a better one.” This is a lesson many teams learn the hard way when they find that simplified models can no longer answer the questions they were built to address.
Practical resources on 3D and 4D infrastructure mapping and on virtual cities for planning provide detailed guidance on managing these trade-offs at different scales. If you are working on a complex regeneration project, the article on redevelopment with digital twins is particularly relevant.
Pro Tip: Use dynamic LOD rendering, where your platform automatically switches between detail levels based on zoom and analysis type. This keeps performance smooth during city-scale exploration while still delivering full detail when you zoom into a specific site.
Evaluating outcomes: Optimisation and stakeholder engagement
With efficient models in place, the final step is to review outcomes, understand trade-offs, and ensure engagement with all stakeholders. Producing an optimised model is only valuable if the results are clearly communicated and genuinely inclusive.
Pareto frontiers visualise trade-offs between competing objectives, hybrid typologies help balance density with liveability, sensitivity analyses test how robust your results are to different priority weightings, and dynamic LOD supports continued performance as your model evolves. These are not optional extras; they are the tools that turn a technical output into a defensible planning decision.
To move from model outputs to actionable decisions, follow this process:
- Map your objectives. Define what you are optimising for: journey times, carbon emissions, flood risk reduction, affordable housing provision, or a combination. Be explicit about the priority order so your algorithms know what to balance.
- Generate a Pareto frontier. Run your multi-objective optimisation to produce a set of non-dominated solutions. Each point on this frontier represents a scenario where improving one objective requires accepting a worse outcome on another.
- Visualise the trade-offs clearly. Present the Pareto frontier to decision-makers as an interactive chart or 3D visualisation. Make it possible to click on a scenario and see what it means in spatial terms.
- Involve stakeholders early. Use your 3D model as a communication tool in public consultations and technical workshops. Stakeholders engage far more constructively when they can see and interact with a realistic representation of proposed changes.
- Run sensitivity analyses. Test your preferred scenario against alternative priority weightings to ensure it remains robust. A solution that only works under one specific set of assumptions is fragile.
- Document your decisions. Record which scenario was chosen, why, and what the expected outcomes are. This creates an audit trail and a baseline against which you can measure real-world performance.
| Outcome evaluation tool | What it reveals | When to use it |
|---|---|---|
| Pareto frontier | Trade-offs between competing objectives | Multi-objective optimisation stages |
| Sensitivity analysis | Robustness of results to priority changes | Before final decision sign-off |
| Hybrid typology modelling | Balance between density and liveability | Residential and mixed-use masterplanning |
| Stakeholder visualisation | Public acceptability of proposals | Consultation and approval stages |
The digital twin city platform and dedicated digital twin urban planning tools are designed specifically to support this kind of multi-objective, stakeholder-facing evaluation.
What most planners miss about 3D city optimisation
There is a pattern we see repeatedly in urban planning projects. Teams invest heavily in acquiring the latest visualisation software and building visually impressive models, but they overlook the quieter, less glamorous work that actually determines whether a project succeeds. The most common gap is interoperability.
Many planners treat data standards as a back-office concern, something for the GIS technicians to sort out. But when a traffic model cannot talk to a flood model, or a BIM export loses its semantic attributes on import into a city model, the result is that decisions get made on incomplete information. Prioritising established standards like CityGML 3.0 for interoperability, combining these with AI and machine learning for predictive maintenance and scenario testing, and focusing on multi-stakeholder platforms for inclusive planning are the three levers that consistently deliver the most value.
The second overlooked area is predictive analytics. Most teams use their 3D models reactively, running simulations after a design has been proposed to check whether it performs adequately. The smarter approach is to use AI-driven models to anticipate infrastructure failures before they occur, and to generate design options rather than just evaluate them. This shifts the planner from reviewer to navigator.
The digital twins revolution is not primarily about better visualisation. It is about better intelligence. And the platforms that are transforming city planning most effectively are those that connect real-time data, predictive algorithms, and genuine stakeholder access within a single environment.
Finally, do not underestimate the value of a multi-stakeholder platform. When residents, engineers, planners, and elected officials can all interact with the same 3D model, the quality of the conversation changes fundamentally. Decisions become more transparent, objections surface earlier, and the final outcomes are more widely accepted. That kind of inclusive process is not a soft benefit; it directly reduces the risk of costly project delays.
Take your city planning to the next level with 3D Cityplanner
If the frameworks and methods covered in this article reflect the direction you want to take your projects, the next practical step is finding a platform that supports all of it in one place. Sophisticated planning requires tools that match that ambition.
The 3D Cityplanner platform brings together automatic building generation, line-of-sight visualisation, noise simulation, 4D timeline planning, and BIM and GIS integration within a single, professional environment. Whether you are testing flood scenarios, modelling energy demand, or presenting phased development proposals to stakeholders, 3D Cityplanner is built for the full planning lifecycle. You can start with a free trial and explore the full feature set without any upfront commitment, making it straightforward to assess whether it meets your specific project needs.
Frequently asked questions
What is a digital twin in city infrastructure planning?
A digital twin is a virtual replica of physical city assets and systems, used to simulate and optimise infrastructure scenarios including traffic flow, energy demand, and flood risk in real time.
How does CityGML 3.0 improve interoperability in infrastructure modelling?
CityGML 3.0 integrates heterogeneous data from BIM, GIS, and point clouds into a single semantic framework, reducing model redundancies and enabling seamless collaboration across different platforms and organisations.
What are common challenges when modelling urban infrastructure in 3D?
Geometric complexity, semantic heterogeneity, and scalability are the primary challenges, typically requiring simplification algorithms, application domain extensions, and performance-focused tiling strategies to manage effectively.
How can planners ensure inclusive optimisation outcomes?
Use multi-objective algorithms and Pareto frontiers to visualise trade-offs between competing priorities, and build stakeholder engagement directly into the modelling process through interactive 3D visualisations and scenario-based workshops.
Recommended
- Optimise city development with advanced 3D strategies – 3D Urban Development
- Why optimise city planning: 3D tools for better design – 3D Urban Development
- Urban project optimisation with advanced 3D tools in 2026 – 3D Urban Development
- How to optimise city layouts with advanced 3D tools – 3D Urban Development