Top 5 Urban Development Visualization Tools Alternatives 2026

Choosing an urban development visualisation platform that brings together 3D context, scenario testing and accessible stakeholder tools without excluding new users or requiring heavy desktop installs remains a challenge for planning teams. Many established solutions lock core capabilities like cloud access, GIS integration or scenario comparison behind complex enterprise pricing or demand extensive technical setup that slows rapid iteration. This article covers the trade offs in price, data compatibility and user experience across five urban development visualisation software alternatives so you can match a tool to your project needs before engaging with sales.
Table of Contents
- 3D Cityplanner
- UrbanSim
- UrbanFootprint
- Collective Form
- Blocktype
- Comparative Analysis of Urban Development Visualisation Tools
3D Cityplanner
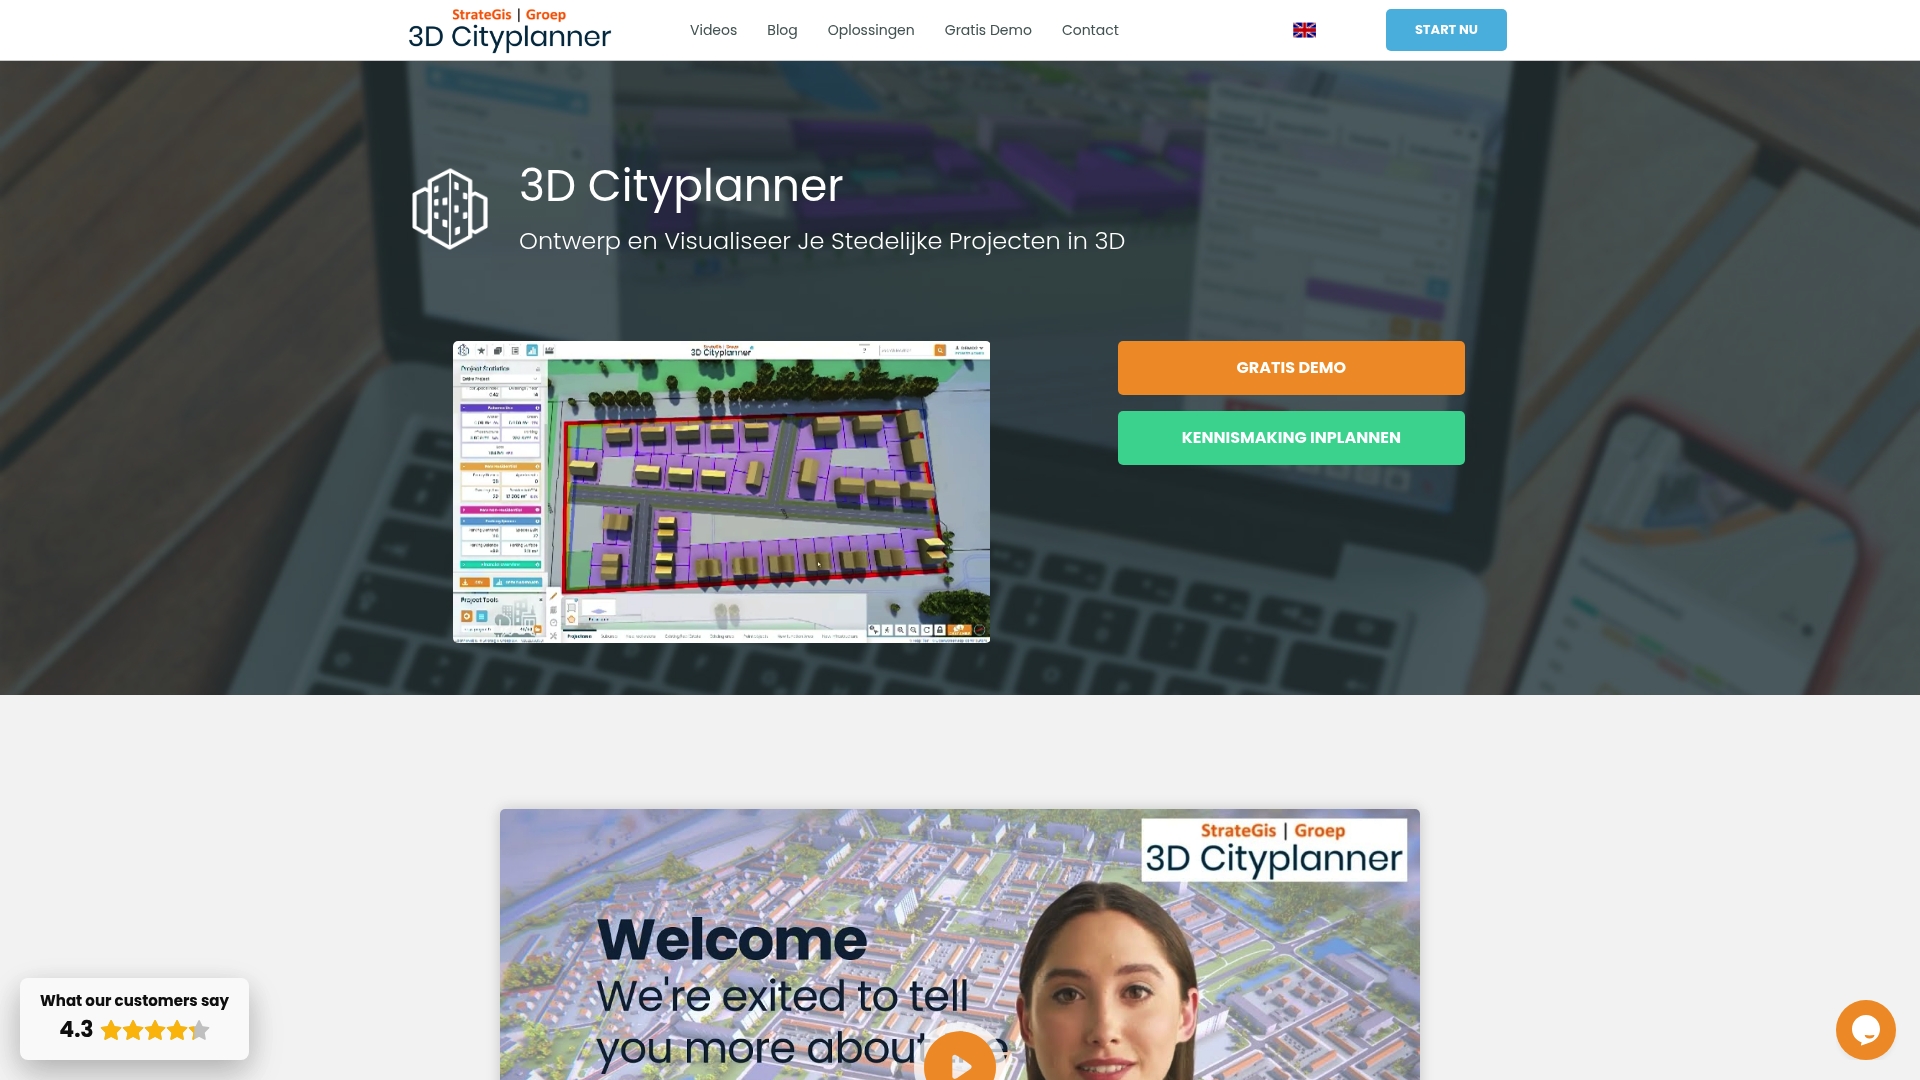
At a Glance
3D Cityplanner runs entirely in the browser and combines geospatial data with parametric tools and scenario comparison so teams can test alternatives without local software installs. The platform also offers automatic building generation, line-of-sight visualisations and noise simulation modules.
Core Features
Interactive 3D visualisation of existing context and proposed developments with support for GIS layers BIM and common 3D datasets. The browser approach reduces setup time and lets multiple stakeholders view the same scene.
- Automated building generation for rapid massing and layout testing.
- Parametric design controls to adjust building form and urban grain in real time.
- Scenario comparison that holds multiple layouts and metrics in one workflow for trade-off analysis.
Key Differentiator
The platform’s strength is the tight combination of GIS integration parametric modelling and scenario comparison within a browser interface. That mix lets planning teams iterate spatial policy tests and design variants collaboratively without moving files between desktop tools.
Pros
- Facilitates clearer stakeholder meetings by presenting proposals as explorable 3D scenes rather than static drawings. Teams report faster alignment when citizens and councillors can pan and rotate proposals themselves.
- Integrates diverse data sources such as GIS layers BIM and external 3D models so the same project can reuse municipal datasets and consultant deliverables.
- Rapid scenario creation through automated massing means you can generate several density and layout options in the time a traditional modelling workflow would produce one.
- Built-in spatial analyses such as shadow studies visibility assessments and environmental noise simulation let you attach measurable outcomes to each scenario before public consultation.
- Offers educational material training and trial periods without prior payment which helps teams test workflows before committing to a procurement process.
Cons
- The browser focus and breadth of features are complex for very small projects or users unfamiliar with 3D modelling; a short onboarding period is usually required to match expectations.
Who It’s For
Municipal urban planners city development teams urban designers and project developers who need integrated 3D visualisation and scenario analysis in a collaborative setting. It suits teams that work with GIS and BIM data and that want to involve stakeholders directly in visual review sessions.
Unique Value Proposition
Being browser based removes desktop installation and file handover friction. For multi‑agency projects this turns version control from a coordination problem into an operational one the project can manage in meetings. That changes how quickly iterations reach decision makers.
Real World Use Case
A city planning department imports municipal building footprints and street centrelines then uses automated timelines to present 4D phasing of a neighbourhood expansion. Planners compare low and medium density scenarios measure shadow impact and present interactive views at a public consultation.
Pricing
Not applicable — informational only. The vendor offers trial periods without prior payment and provides training and educational resources to help new teams validate the tool in local workflows.
Website: https://3dcityplanner.com
UrbanSim
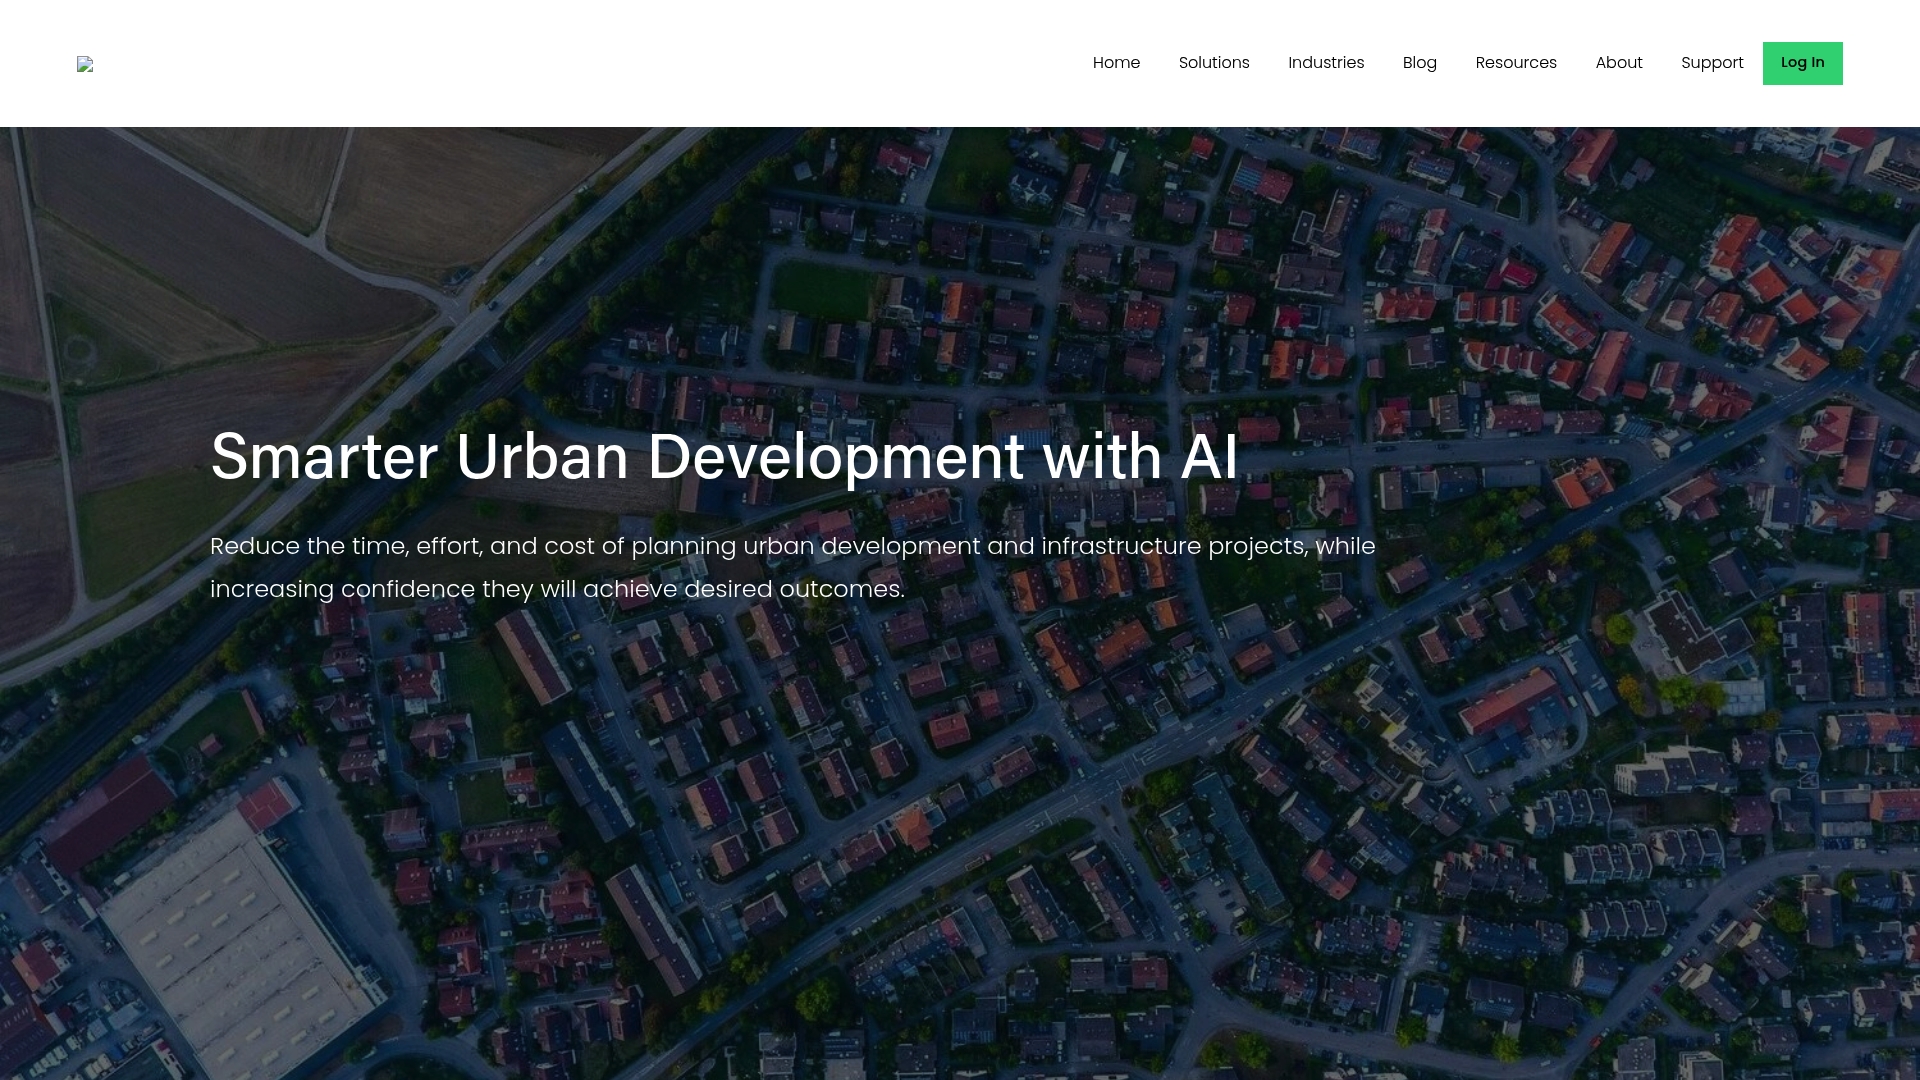
At a Glance
UrbanSim’s marketing materials state the platform spans over 80 million residents across five continents and cites more than 10,000 academic references. The system models land use, transport, economic and environmental interactions and supports parcel, block or zonal resolution for scenario comparison and feasibility work.
Core Features
- Urban simulation modelling that links land use, transport, the economy and the environment to test policy and development scenarios.
- 3D visualisation for immersive exploration of alternative growth patterns and design options with stakeholder-friendly views.
- Shared open data infrastructure to centralise inputs and outputs for repeatable analysis across teams.
- Scenario comparison and impact analysis for zoning, policy appraisal and development proposals.
- Cloud-based scalable simulation that permits iterative runs and sensitivity tests in minutes rather than days.
Key Differentiator
The vendor positions UrbanSim around behavioural realism combined with policy sensitivity and scalable compute. That mix is reinforced by academic partnerships and applied regional projects, which the marketing materials highlight as the source of its modelling credibility.
Pros
- Behavioural modelling gives planners more defensible forecasts than simple trend extrapolation, which helps when testifying to councils or producing evidence for local plans.
- The platform handles multiple geographic granularities, from parcel-level feasibility to zonal strategic scenarios, so one tool can support both masterplans and permit-stage analysis.
- Collaboration features and open data support public engagement; visual outputs are easier for stakeholders to interpret than raw tables of numbers.
- Cloud execution and data science tooling accelerate iteration; teams can run sensitivity sweeps and compare scenarios within a working day.
- The product has an established presence with regional planning organisations and academic groups, a track record frequently cited in marketing materials.
Cons
- Several buyer reviews report a steep learning curve; users new to microsimulation or transport modelling will require training or external support.
- Implementation and calibration demand substantial local data preparation and technical effort, especially for parcel-level fidelity.
- Advanced features often need professional services to configure and validate, which raises project costs for small teams.
When It May Not Fit
Small councils or private developers without access to technical staff or consulting budgets will find the platform heavy. If you need quick, low-friction visual mockups for a single site rather than calibrated regional forecasts, lighter modelling or purely visual tools will be faster and cheaper.
Who It’s For
Urban planners, regional agencies, academic modelers and policy teams seeking evidence-based scenario appraisal. Best where organisations can supply local datasets or engage technical partners to calibrate models and interpret outputs for decision makers.
Real World Use Case
A metropolitan planning organisation uses UrbanSim to quantify how proposed zoning changes affect housing affordability, transit accessibility and emissions. The simulations inform a public consultation cycle and provide figures that planners include in impact reports to elected officials.
Pricing
UrbanSim does not publish fixed prices. Licensing and services are typically tailored to project scope and scale, with options for software licences, hosted cloud runs and professional calibration services depending on the engagement.
Website: https://urbansim.com
UrbanFootprint
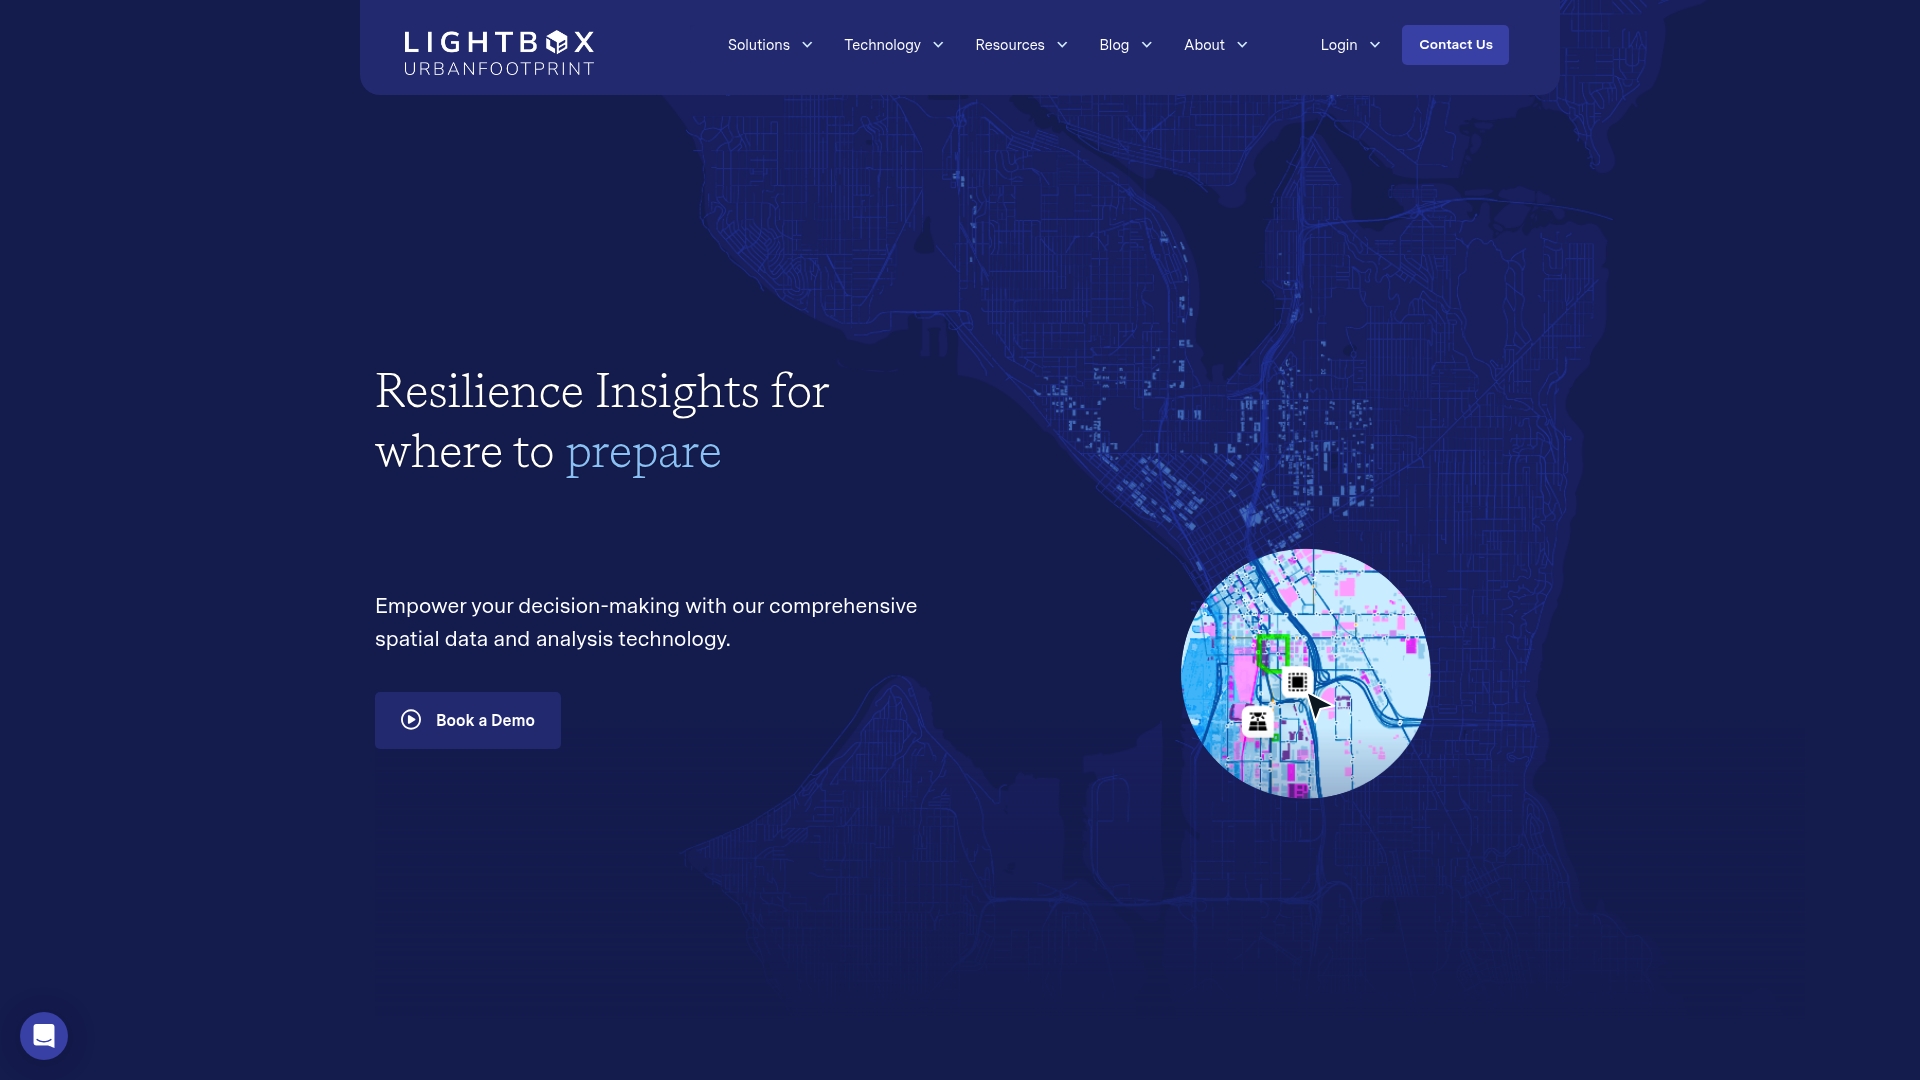
At a Glance
UrbanFootprint’s marketing materials state the platform curates combined datasets across land use, the built environment, community vulnerability and climate hazard risk. That tight dataset intersection is aimed at turning spatial complexity into identifiable resilience priorities for decision makers.
Core Features
- Curated geospatial datasets that span land use, built form, hazard layers and social vulnerability to support comparative analysis across jurisdictions.
- Resilience Insights for investment prioritisation and risk assessment with analytical outputs designed for planners and investors.
- Analyst application for cloud GIS analysis and Explorer for map visualisation and dashboarding.
- Flexible data feeds which let teams push model outputs into client systems and bespoke workflows.
Key Differentiator
The product’s datasets and models are assembled specifically where urban, climate and community data overlap. That dataset focus turns typical hazard maps into prioritised actions rather than raw layers, giving planners a direct line from spatial analysis to investment questions.
Pros
- The vendor states it is trusted by leading Organisations in government, utilities and finance, a signal that teams with regulatory or funding obligations find the platform credible.
- The combined hazard and socio economic layers speed scenario testing for flood, heat and infrastructure failure, which helps you justify spending plans to non technical stakeholders.
- Cloud GIS access means analysis can be shared across departments without heavy desktop GIS licences, improving cross team collaboration on project briefs.
- Visual dashboards in the Explorer application let you package maps and metrics for council briefings and board papers without exporting static images.
- Flexible data feeds reduce repetition by letting you connect outputs to asset management systems or investor due diligence pipelines.
Cons
- The platform’s depth and the variety of models can create a steep learning curve for new users and for teams without GIS specialists.
- Pricing and specific capability tiers are not published, so procurement will likely require detailed conversations with sales to define scope and cost.
- For very small projects the platform’s complexity and setup effort can be disproportionate to the outcome; lighter tools may be faster for one off studies.
When It May Not Fit
If your team lacks someone with GIS or spatial analysis experience then onboarding will be slower and you will need training or consultancy support. The product is built for institutional workflows rather than ad hoc, single study work.
If you need fixed, transparent list pricing to compare against other vendors during a tight procurement window the absence of publicised tiers may make the evaluation process longer.
Notable Integrations
- Cloud based GIS mapping integration for web delivery of maps and dashboards.
- Data feeds to third party systems so outputs can flow into asset management, permitting or investor reporting platforms.
Who It’s For
Urban planners, government resilience teams, utilities and financial institutions that require spatially explicit risk assessment tied to investment decisions. Teams that must defend capital allocations or explain trade offs to elected officials will find the platform aligned with their needs.
Real World Use Case
A city planning team used the platform to map residential areas at highest flood risk and overlay social vulnerability indices. The prioritised list of mitigation sites fed directly into a five year capital programme and supported grant applications with mapped evidence.
Pricing
Pricing is not publicly disclosed and appears to be customised by organisational need. Expect a procurement conversation to define scope, user licences and data services before a formal quote is provided.
Website: https://urbanfootprint.com
Collective Form
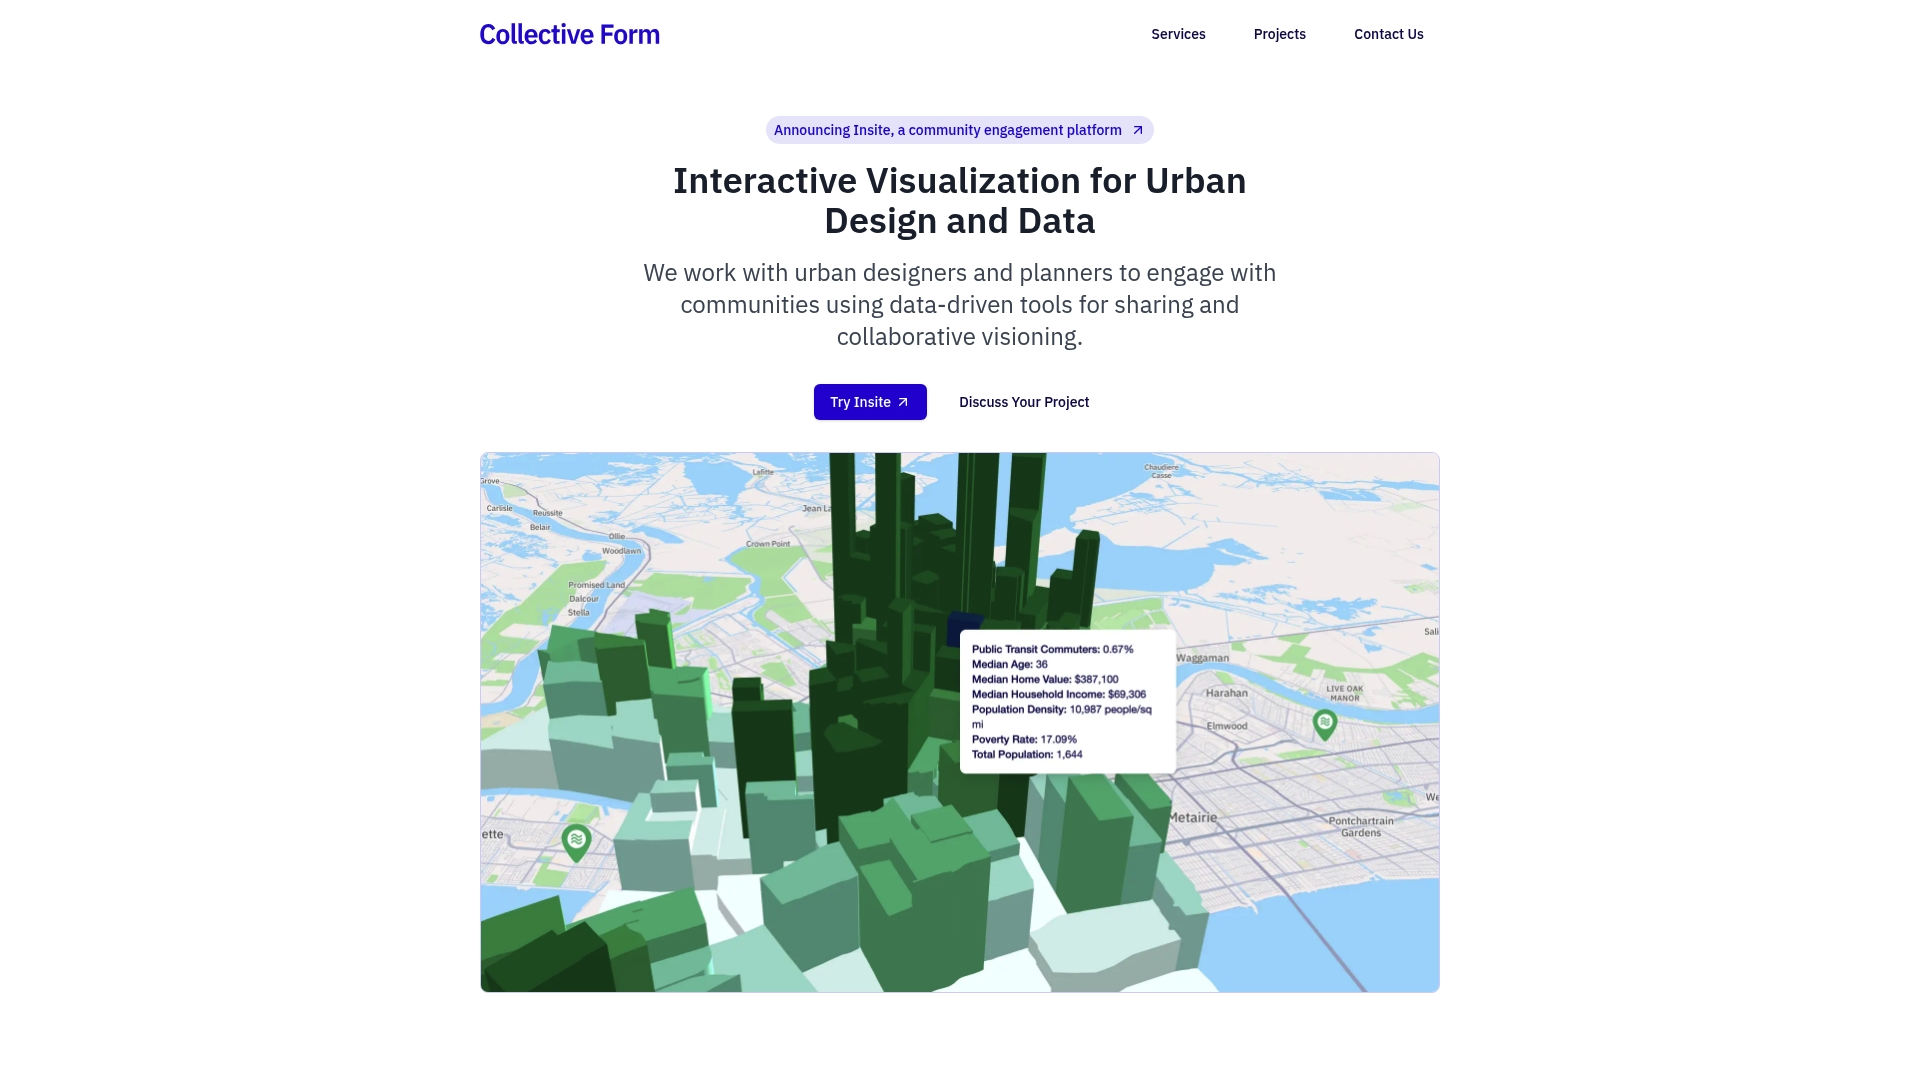
At a Glance
Collective Form’s marketing materials state rapid project launch times of 1–5 days, a claim that underpins its focus on short lead civic consultation and fast community portals.
The portfolio cites work such as Claiborne Reborn in New Orleans and the Syracuse Community Grid Vision Plan, both oriented around reconnecting neighbourhoods and visualising change for public review.
Core Features
The product bundles community engagement portals for public input, a GIS + engagement suite that lets participants leave map comments on layered spatial data, and interactive GIS dashboards that surface spatial patterns without heavy technical setup.
Operational details include rapid project spin up, one-year hosting and exportable datasets so councils and consultants can archive responses or hand off data to internal systems.
Key Differentiator
Collective Form specialises in rapid deployment of community engagement and spatial analysis for urban design projects. That tight focus on quick launch and low technical overhead sets it apart from broader 3D planning tools such as 3dcityplanner, which target deeper 3D modelling and extended analysis workflows.
Pros
- Enables broad public participation through map based comments and simple portals that lower the barrier to contribute.
- Supports fast delivery so teams can run short consultation windows; refer back to that 1–5 days claim when scheduling tight project calendars.
- Provides detailed spatial visualisation and dashboards that help pinpoint neighbourhood patterns without needing GIS specialists.
- Designed to accommodate city governments, consultants and community organisations with minimal setup work.
- Exportable feedback and one-year hosting simplify record keeping and transfer of community data to other teams.
Cons
- Third-party reviews note limited customisation for complex or large scale projects which constrains bespoke workflow needs.
- Buyers seeking enterprise grade, deeply customised solutions will likely require additional development work beyond the out of the box offering.
- Available material gives sparse information about integration with legacy city systems or on premise asset management tools.
When It May Not Fit
If your programme requires heavy custom workflows, on premise integration with asset registries, or enterprise single sign on across dozens of departments, Collective Form may be a poor match.
Organisations planning multi year modelling, advanced 3D visualisation or bespoke plugin development should look elsewhere or budget for custom engineering work.
Who It’s For
Urban planners, city officials, community organisations and urban design consultants who need quick interactive consultation tools for neighbourhood plans, land use and transportation projects will find Collective Form well aligned to their timelines.
It suits teams that prioritise public input and spatial feedback over extended 3D modelling or lengthy platform customisation.
Real World Use Case
A city government used Collective Form’s GIS + Engagement Suite to gather dispersed community feedback for an urban renewal scheme. Residents dropped comments on an interactive map; staff exported the dataset and visualisations for council briefings and evidence led decision making.
Website: https://collectiveform.io
Blocktype
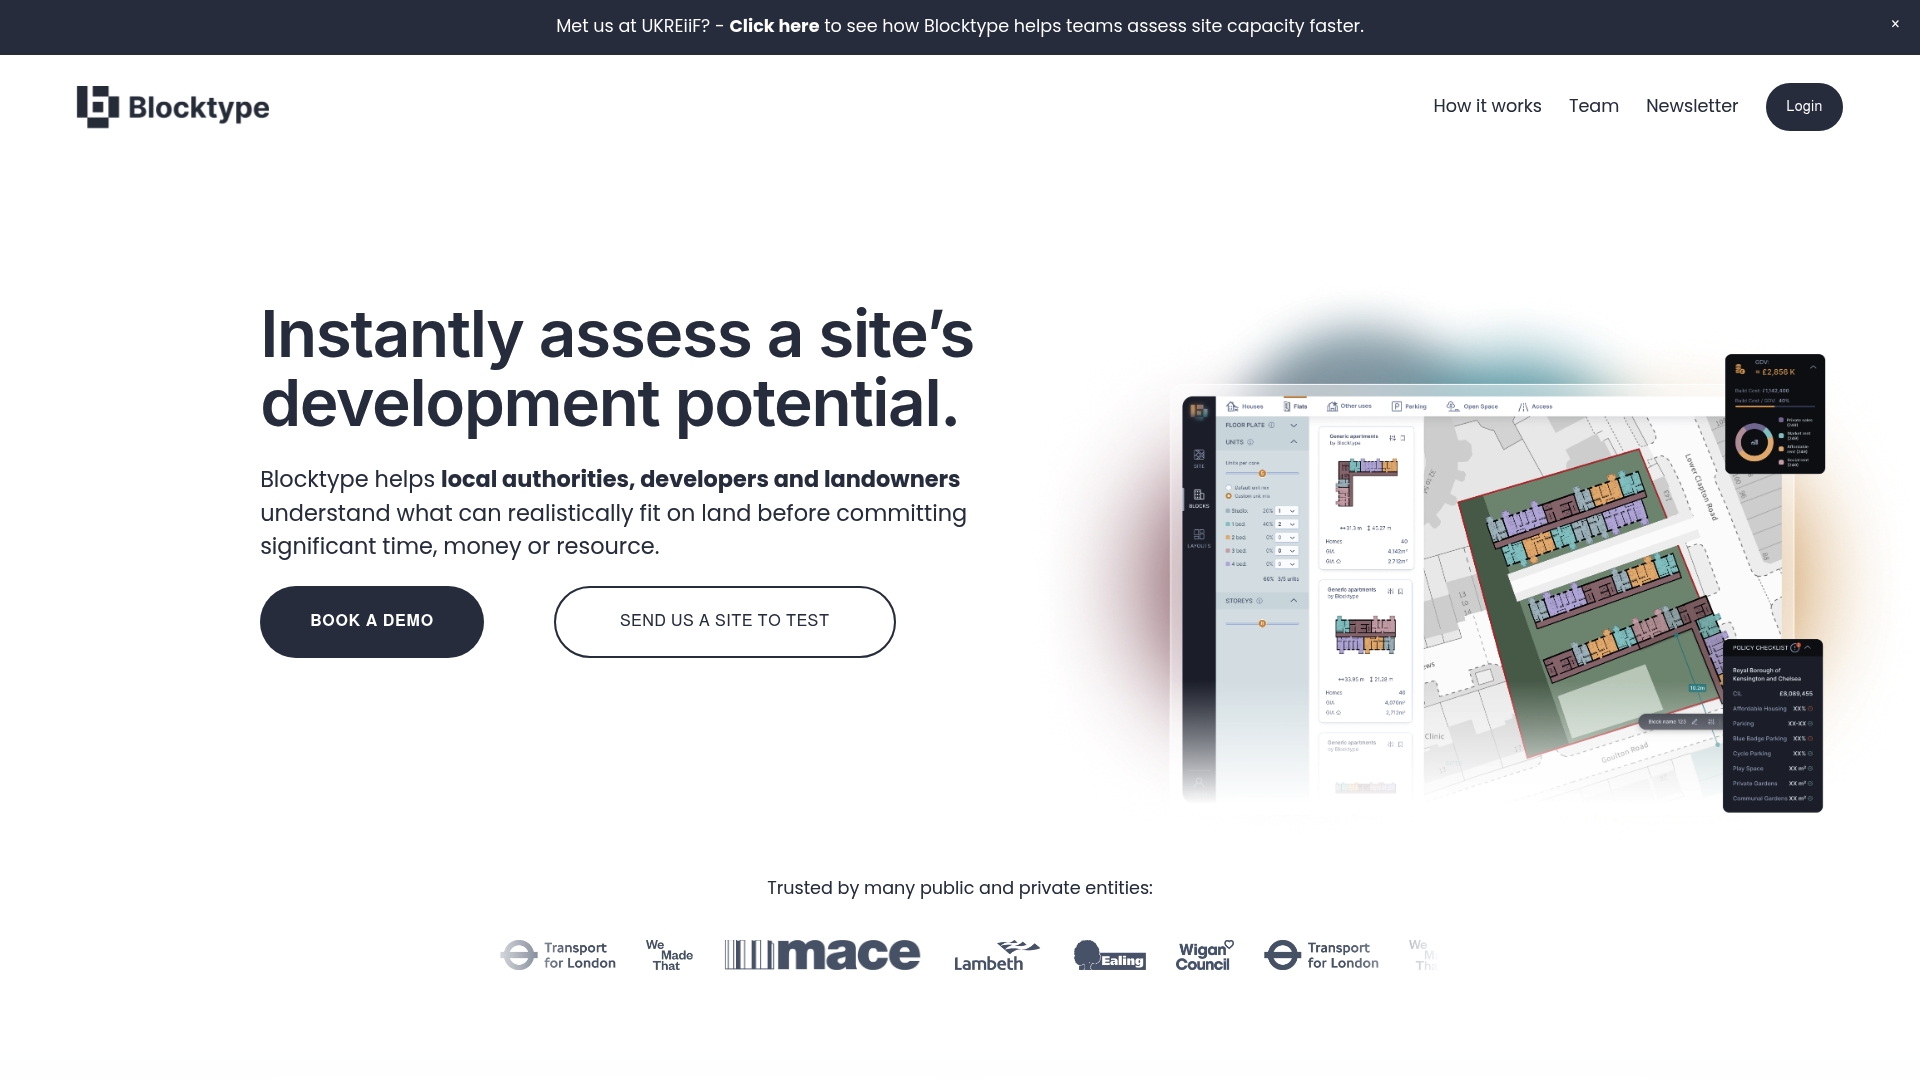
At a Glance
Integrated geographic data layers combine with drag-and-drop layout creation and early GDV calculations to let planners test multiple scenarios in hours rather than weeks. The tool targets internal feasibility work so teams can rule sites in or out before commissioning external consultants.
Core Features
- Spatial site analysis with layered constraints such as flood zones, conservation areas, listed buildings, topography and building heights.
- Drag-and-drop layout creation using pre-designed residential typologies for rapid massing and unit mix exploration.
- Early cost and value calculation that estimates build costs, GDV and residual land value during initial appraisal.
- Scenario comparison with side-by-side reports, schedules and visualisations for internal review and stakeholder discussion.
Key Differentiator
Blocktype pairs local geographic layers with quick scenario testing in a single visual environment. That combination makes it faster to move from constraint mapping to a quantified viability snapshot, which is specifically useful for teams that run many small feasibility exercises.
Pros
- Speeds internal feasibility. Teams report fewer early consultant commissions because basic capacity and viability can be proved or dismissed in-house.
- The layered geographic data helps you spot policy and physical constraints early, reducing wasted design work later.
- Scenario comparison exports clear schedules and visuals that support internal prioritisation or briefing external consultants.
- Rapid layout iteration lets planners explore density and unit mix permutations without rebuilding models for each option.
- Collaboration tools and report generation mean stakeholders see the same assumptions, which shortens internal decision cycles.
Cons
- Designed for early-stage appraisal only; it does not replace detailed feasibility, technical surveys or a formal planning submission.
- New users unfamiliar with spatial planning tools face a learning curve before they produce polished outputs.
- Functionality for detailed design or construction planning is limited, so models will need exporting into specialist design software.
- Output quality depends on local geographic data; in areas with poor base data the results need closer scrutiny.
When It May Not Fit
If you are preparing a final planning submission, coordinating detailed construction packages, or require CAD-level design detail, Blocktype will not satisfy those needs. Also avoid it where reliable base map or cadastral data is unavailable, since some outputs depend on that data quality.
Who It’s For
Local authority planning teams, landowners and small to mid-sized developers who run frequent site assessments and require rapid, evidence‑based prioritisation. It suits users who want to reduce external consultancy spend during early stages and who can translate high level outputs into next steps.
Real World Use Case
A council used Blocktype to screen ten brownfield parcels in a single week. Planners mapped constraints, tested three density scenarios per site and produced comparative viability reports that fed straight into a prioritisation paper for members.
Pricing
Blocktype’s published product data lists pricing as “Not applicable — informational only.” For procurement or trial details contact the vendor directly.
Website: https://blocktype.co.uk
Comparative Analysis of Urban Development Visualisation Tools
Planning teams seeking tools for urban development visualisation and assessment can choose from a range of platforms, each catering to specific project needs and expertise. Below, I present an analysis of these platforms, highlighting their unique strengths and suitable applications.
Data Integration Depth and Analysis Complexity
UrbanSim demonstrates strong capabilities in accommodating detailed geographic and economic modelling, offering users detailed behavioural insight coupled with scalable computational tools. This makes it well-suited for regional planning initiatives requiring data calibration and sensitivity testing. However, its demand for extensive local data preparation and technical expertise imposes higher barriers to entry, making it a better fit for experienced teams with dedicated resources.
Conversely, 3D Cityplanner integrates geospatial data directly within a user-friendly browser interface, enabling collaborative and iterative planning without the overhead of desktop installations. This makes it an efficient solution for municipal planning teams targeting streamlined stakeholder involvement.
Usability and Project Scale Considerations
Tools like Collective Form and Blocktype excel in quick project iterations and are tailored toward smaller teams or initiatives with constrained timelines. While lacking the complexity of UrbanSim or UrbanFootprint, their interfaces allow users to derive meaningful insights with minimal setup and expertise. Collective Form stands out for public engagement through intuitive GIS-enabled commenting features, whereas Blocktype focusing on initial feasibility studies benefits small to mid-sized developers with its drag-and-drop layout tools.
Best Fit
- 3D Cityplanner: Browser-based ease of use coupled with GIS and 3D modelling makes this tool a top pick for municipal planners looking to enhance collaboration and stakeholder visualisation workflows.
- UrbanSim: Its behavioural and economic modelling offers compelling insights for large-scale, data-driven urban policy evaluations, despite its steeper learning curve.
- UrbanFootprint: Offers curated data layers that aid in prioritising resilience-related actions, aligning well with organisations focused on vulnerability mitigation.
- Collective Form: Fits quick-turnaround consultancy projects that prioritise public feedback on urban designs.
- Blocktype: Functions effectively for preliminary site-level feasibility analyses.
Our Pick
3D Cityplanner provides an excellent balance of ease of use, collaborative capacity, and analytics for urban planning projects incorporating GIS data, 3D modelling, and scenario evaluation. While it may not meet the needs of highly data-intensive initiatives at a regional scale (a domain better suited to UrbanSim or UrbanFootprint), its combination of accessibility and functionality makes it a valuable tool for broad urban development tasks.
Urban Development Visualisation Tools Comparison
Determine which platform aligns with your team’s need for integrated 3D design and data-driven scenario evaluations.
| Product | Core Feature | Key Differentiator | Best For | Pricing | Limitation |
|---|---|---|---|---|---|
| 3D Cityplanner | Interactive 3D visualisation linked to GIS and parametric design | Runs in-browser unifying GIS, 3D design, and analysis | Municipal planners and urban developers | Not disclosed | Onboarding effort needed for non-3D-experienced teams |
| UrbanSim | Advanced urban simulation modelling and policy sensitivity | Behavioural realism paired with scalable compute | Academic groups and policy-makers | Not disclosed | Demands extensive local data and technical expertise for configuration |
| UrbanFootprint | Combined datasets for risk and investment analysis | Targets overlap of climate, community, and urban data | Agencies addressing resilience and equity | Not disclosed | Requires GIS knowledge for optimal use |
| Collective Form | Rapid deployment of community planning tools | Specialises in fast public consultation facilitation | Community-driven urban design projects | Not disclosed | Limited for enterprise-level bespoke or highly complex projects |
| Blocktype | Drag-and-drop spatial layout tools for feasibility assessments | Early-stage GDV and constraint analysis in hours | Developers in early feasibility checks | Not disclosed | Not suitable for detailed submissions or areas with poor base data |
Discover Powerful 3D Urban Development Visualisation Tools with 3dcityplanner
When selecting urban development visualisation tools, key challenges include managing complex geospatial data across multiple stakeholders and rapid scenario testing without cumbersome software installations. If you seek a tool that offers automatic building generation, real-time parametric adjustments and integrated scenario comparison all within an easy browser interface 3dcityplanner answers those needs with robust features tailored for planners and developers.
Why choose 3dcityplanner?
- Collaborative 3D scene exploration with GIS and BIM data support
- Noise simulation and line-of-sight visualisations for measurable insights
- 4D project phasing to review developmental timelines seamlessly
Explore how 3dcityplanner can accelerate your urban planning processes and improve stakeholder communication. Visit 3dcityplanner’s official site to start your free trial and experience automatic building generation and scenario analysis designed to bring your urban visions to life.
Frequently Asked Questions
What unique feature does 3dcityplanner offer for collaborative urban development?
3dcityplanner provides interactive 3D visualisation of existing contexts and proposed developments, allowing multiple stakeholders to view the same scene. This feature reduces setup time and ensures effective discussions during stakeholder meetings. Teams can expect clearer communication and alignment during project consultations when using this tool.
How does UrbanSim compare to 3dcityplanner in terms of modelling capabilities?
UrbanSim excels in giving planners more defensible forecasts through its comprehensive urban simulation modelling that links land use, transport, the economy, and environmental factors. While UrbanSim offers in-depth policy sensitivity and granularity for parcel-level scenarios, 3dcityplanner is better suited for rapid visualisation of multiple layout options in a collaborative environment. Consider what aspects are more critical for your project: detailed modelling versus quick visual feedback.
Can UrbanFootprint’s approaches be combined with 3dcityplanner for a more comprehensive view?
UrbanFootprint’s strength lies in its curated geospatial datasets that focus on resilience and climate hazards, providing critical insights for investment prioritisation. Using these insights alongside 3dcityplanner could enhance your overall assessment of urban resilience in proposed designs, especially when considering social vulnerabilities and hazards.
What onboarding challenges might users face with 3dcityplanner?
Users may find a short onboarding period necessary to utilise 3dcityplanner effectively, as the browser-based platform has a breadth of features that could be complex for very small projects. Expect to invest time in familiarising yourself with the interface to maximise the tool’s capabilities.
How quickly can 3dcityplanner help generate layout options compared to traditional methods?
3dcityplanner allows for rapid scenario creation through automated building generation, enabling users to explore several density and layout options in the time a traditional modelling workflow would produce just one. This means teams can test various alternatives much more efficiently before settling on a final design.