How to analyse site data for urban development

Site data analysis is the process of integrating diverse spatial and environmental datasets to generate the insights that drive early-stage urban development decisions. For urban planners, architects, and real estate developers, this process determines whether a site is viable, what constraints it carries, and which development scenarios are worth pursuing. The industry term for this integrated approach is site characterisation, and it draws on GIS layers, environmental surveys, 3D city models, and structured decision frameworks. Getting it right at the outset saves significant time and cost later in the project lifecycle.
How to analyse site data: the essential data types
The first step in any site characterisation is knowing which data categories to gather and where to find them. Missing a single layer, such as a flood risk zone or a utility corridor, can invalidate an entire feasibility study.
The core data categories for urban development site analysis are:
- GIS layers: zoning maps, land use classifications, parcel boundaries, cadastral data, and planning designations from municipal GIS portals
- Infrastructure and mobility: road networks, public transport routes, utility corridors, drainage systems, and cycle infrastructure
- Environmental data: sunlight exposure patterns, shadow casting, microclimate conditions, soil and groundwater conditions, and flood risk zones
- Greenery and public space: tree canopy coverage, parks, ecological corridors, and permeable surface ratios
- Building and development data: existing structures, building heights, floor area ratios, and development capacity assessments
- Subsurface data: boring logs, geophysical surveys, and real-time sensor readings
Site-specific measurements combined with orthophotos, LiDAR, hydrology, climate data, and utility maps significantly improve the completeness and accuracy of site characterisation. This means that relying solely on municipal GIS portals will leave gaps that only field surveys or national databases can fill.
Data sources include local authority GIS portals, national land registries, satellite imagery providers, the Ordnance Survey in the UK, and on-site measurement campaigns. Platforms like 3D Cityplanner aggregate these datasets into a single browser-based environment, allowing planners to overlay zoning, sunlight, visibility, and infrastructure data simultaneously rather than switching between disconnected tools.

Pro Tip: When collecting GIS data from multiple sources, always record the coordinate reference system for each dataset before importing. A mismatch between OSGB36 and WGS84, for example, will shift building footprints by hundreds of metres and corrupt your entire spatial analysis.
| Data category | Primary sources |
|---|---|
| Zoning and land use | Municipal GIS portals, national planning databases |
| Environmental conditions | Satellite imagery, meteorological services, field surveys |
| Infrastructure and utilities | Utility providers, transport authorities, OS MasterMap |
| Building stock | Cadastral registers, LiDAR point clouds, 3D city models |
| Subsurface conditions | Geotechnical reports, borehole databases, geophysical surveys |
How do you integrate multiple datasets into a coherent model?
Collecting data is straightforward compared to the harder task of combining it meaningfully. The standard professional framework for this is the Conceptual Site Model, or CSM. A CSM integrates multiple data sources into a unified, decision-focused picture rather than relying on any single dataset in isolation. For urban development, this means combining physical, spatial, environmental, and regulatory data into one coherent analytical model.
The steps for building a decision-grade integrated model are:
- Define your objectives first. Before loading a single dataset, establish what decisions this analysis must support. Is the question about development capacity, infrastructure load, or environmental risk? Objectives shape which data layers matter most.
- Establish a single authoritative database. Strong data management including quality assessment, standardised structure, and metadata tracking is critical for confidence in CSMs and successful decision-making. A single database with tracked data provenance prevents silent inconsistencies that undermine stakeholder trust.
- Apply quality assessment to every dataset. Check for currency, completeness, spatial accuracy, and source credibility before integrating. Outdated zoning data or unverified building heights will produce misleading outputs.
- Layer data in a GIS or 3D environment. Platforms like 3D Cityplanner allow you to visualise zoning, land use, sunlight, visibility, and infrastructure as overlapping layers in both 2D and 3D, making spatial relationships immediately apparent.
- Apply a decision analysis framework. The US EPA’s DASEES process links objectives, options, data evaluation, and adaptive management to support sustainable decision-making. Applying this logic to urban development means connecting your data outputs directly to planning objectives, development options, and their consequences.
- Document all data gaps explicitly. Effective early-stage site analysis distinguishes between available data, inferred conclusions, and recognised data gaps. Explicit gap documentation protects project validity and permits informed risk management.
Pro Tip: Treat your CSM as a living document rather than a one-time deliverable. As new survey data, planning decisions, or environmental monitoring results arrive, update the model and record what changed and why. This audit trail becomes invaluable during planning applications and stakeholder reviews.
The critical insight here is that site data analysis is for decision framing and evaluating tradeoffs, not just descriptive mapping of site conditions. A map showing zoning boundaries is informative. A model that connects those boundaries to development capacity, infrastructure demand, and sunlight performance across three design scenarios is decision-grade.
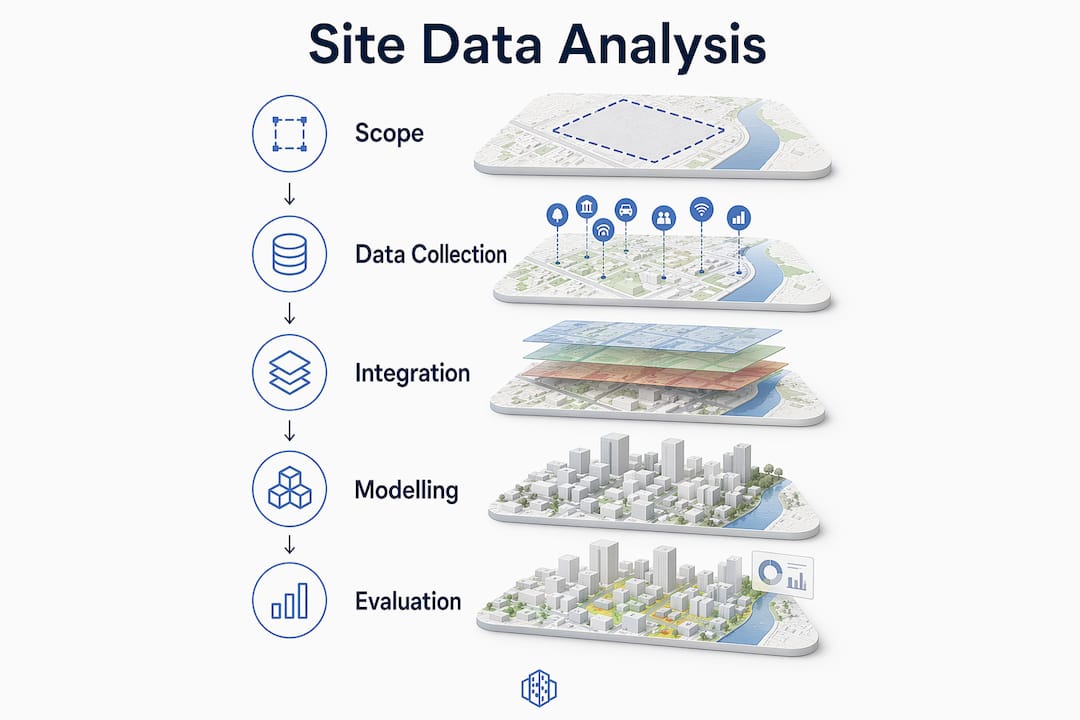
Step-by-step process for analysing site data
A structured workflow prevents the most common failure mode in site analysis: collecting large volumes of data without a clear path from raw information to planning decisions. Use this practical framework as your baseline process.
- Pre-analysis: define scope and objectives. Identify the development goals, the planning constraints, and the key questions the analysis must answer. A residential masterplan requires different data priorities than a mixed-use infill project.
- Data collection: compile and verify all datasets. Gather GIS layers, environmental surveys, building data, and infrastructure records. Verify coordinate systems, check data currency, and flag any missing layers before proceeding.
- Data integration: load and overlay in your analytical environment. Import all verified datasets into a GIS platform or 3D Cityplanner. Align coordinate systems, resolve any spatial conflicts, and create a master project file that serves as your single source of truth.
- Exploratory analysis: evaluate key parameters. Assess zoning compatibility with proposed uses, run sunlight and shadow mapping across different seasons, analyse visibility corridors, calculate parking capacity against development density, and review infrastructure connectivity. Each parameter generates a constraint or opportunity layer.
- Scenario comparison in 3D. Model at least two or three development alternatives and compare them against your defined objectives. A step-by-step site evaluation approach helps structure this comparison systematically, ensuring each scenario is assessed against the same criteria.
- Evaluation and documentation. Record assumptions, data quality limitations, and uncertainties for each scenario. Note which conclusions are supported by verified data and which rely on inferred or estimated values.
- Iterative updates. As new data become available, whether from additional surveys, planning consultations, or updated municipal datasets, revise the model and reassess conclusions.
| Analysis stage | Key output |
|---|---|
| Scope definition | Objectives register and data requirements list |
| Data collection | Verified, georeferenced dataset inventory |
| Integration | Single master project file with layered GIS data |
| Exploratory analysis | Constraint and opportunity maps per parameter |
| Scenario comparison | 3D visualisations with performance metrics per scenario |
| Documentation | Assumptions log and data gap register |
Pro Tip: Run your sunlight and shadow analysis for both the summer solstice and the winter solstice. Winter shadow patterns are frequently the binding constraint on building height in dense urban sites, and discovering this late in the design process is costly.
What are the most common challenges in site data analysis?
Even experienced planners encounter recurring problems when analysing site data. Recognising these pitfalls early is more efficient than correcting them after a design has progressed.
- Coordinate system mismatches. Datasets from different sources often use different spatial reference systems. Importing them without reprojection produces spatial errors that corrupt every downstream analysis.
- Outdated or incomplete datasets. Municipal GIS portals are not always current. Zoning maps may not reflect recent amendments, and building height data can lag behind recent construction. Always cross-reference against satellite imagery and planning registers.
- Misalignment between model layers and measurement locations. Model configuration and calibration must align spatially and temporally with data collection methods to produce meaningful outputs. If your sunlight model uses a building height that differs from the surveyed height, the shadow analysis is unreliable.
- Ignoring climate resilience factors. Resilience considerations are increasingly essential in site data analysis, requiring planners to assess future risks from flooding, drought, and sea level rise using authoritative available data. Omitting these factors from early-stage analysis creates liability later.
- Undocumented data gaps. Failing to record what data is missing, and what assumptions fill those gaps, is the most common cause of contested planning decisions. The ASTM E1527-21 framework for Phase I Environmental Site Assessments stresses explicit documentation of data gaps and their potential impact on recognised environmental conditions.
- Siloed data management. When different team members hold separate versions of the same dataset, inconsistencies accumulate silently. Centralised data management with version control is the practical solution.
“The value of a site model is not in the volume of data it contains, but in the rigour with which that data has been verified, integrated, and connected to the decisions it must inform.”
Calibration and validation of environmental and sunlight models deserve particular attention. Effective calibration involves iterative comparison of model output with observed data using graphical plots and error statistics to confirm reliable results. For urban planners, this means checking sunlight model outputs against measured irradiance data, or verifying traffic flow models against observed counts, before using them to justify design decisions.
How does 3D visualisation improve site data analysis?
Advanced modelling and 3D visualisation transform site data from a collection of maps and tables into a spatial decision environment. The practical benefits for urban planners and developers are significant.
- Mechanistic modelling accuracy. Simulating environmental processes, such as sunlight penetration, wind flow, or drainage patterns, calibrated to site-specific measurements produces outputs that are defensible in planning applications. Generic assumptions do not hold up to scrutiny.
- Subsurface and infrastructure visibility. 3D GIS environments allow planners to visualise underground utilities, geology, and drainage systems in relation to proposed building footprints, preventing costly clashes during detailed design.
- Scenario testing and tradeoff evaluation. Interactive 3D models allow you to test how changing building height, massing, or land use allocation affects sunlight, visibility, parking demand, and development capacity simultaneously. This is the core value of 3D urban design modelling for early-stage feasibility work.
- Stakeholder communication. A 3D visualisation of a proposed development in its urban context communicates constraints and opportunities far more effectively than a GIS layer stack. Municipalities, developers, and community groups all engage more productively with spatial models they can see and interrogate.
- Adaptive management integration. Model outputs feed directly into monitoring plans, allowing planners to define which parameters to track post-development and at what thresholds to trigger design revisions.
Pro Tip: When presenting 3D scenario comparisons to stakeholders, always show the baseline condition alongside the proposed scenarios. Without a clear reference point, stakeholders cannot assess the relative impact of design choices.
Key takeaways
Effective site data analysis requires integrating verified, multi-source datasets into a structured decision model, not simply collecting and mapping spatial information.
| Point | Details |
|---|---|
| Start with objectives | Define what decisions the analysis must support before collecting any data. |
| Build a single authoritative database | Centralised data management with metadata tracking prevents inconsistencies and builds stakeholder confidence. |
| Use a CSM framework | Conceptual Site Models integrate physical, spatial, and environmental data into a unified, decision-grade picture. |
| Document data gaps explicitly | Recording what is missing and what assumptions fill those gaps protects project validity and supports defensible decisions. |
| Apply 3D scenario comparison | Comparing development alternatives in 3D reveals tradeoffs in sunlight, visibility, density, and infrastructure that 2D analysis misses. |
Why I think most site analyses fail before the modelling begins
By Anne Dullemond
After working across numerous urban development projects, the pattern I see most often is not a failure of tools or technology. It is a failure of framing. Teams invest heavily in data collection and modelling, then discover late in the process that the analysis was not structured around the decisions it needed to inform. The data was collected, but the questions were never clearly defined.
The most effective site analyses I have encountered share one characteristic: the team agreed on objectives and performance measures before a single dataset was loaded. This sounds obvious, but it is genuinely rare. When objectives are clear, data gaps become visible immediately, and the team can make an explicit choice about whether to fill them or to document them as assumptions. That discipline is what separates a defensible planning analysis from a collection of maps.
I am also consistently struck by how much value is lost when 3D analysis is treated as a presentation tool rather than an analytical one. Running sunlight, visibility, and development capacity comparisons in a platform like 3D Cityplanner during the feasibility stage, not after the design is fixed, changes the quality of decisions fundamentally. The architecture site analysis workflow that integrates these parameters from the outset is the approach I would recommend to any team working on early-stage urban development.
— Anne Dullemond
Analyse your site data in 3D with 3D Cityplanner
3D Cityplanner is a browser-based urban planning platform that brings together GIS data, zoning, land use, sunlight, visibility, parking, and infrastructure into a single 3D environment. It is built specifically for the early-stage feasibility and site evaluation work that urban planners, architects, and real estate developers carry out before design decisions are locked in.
The platform supports digital twin city modelling, allowing teams to compare multiple development scenarios side by side, assess development capacity, and communicate findings to stakeholders through interactive 3D visualisations. You can explore the full capabilities of the urban design platform or request a demo to see how it handles your specific site data requirements.
FAQ
What is site data analysis in urban planning?
Site data analysis in urban planning is the process of collecting, integrating, and interpreting spatial and environmental datasets to assess a site’s constraints, opportunities, and development potential. It typically includes GIS layers, zoning data, sunlight analysis, infrastructure mapping, and environmental conditions.
What is a Conceptual Site Model?
A Conceptual Site Model, or CSM, is a structured framework that integrates multiple data sources into a unified, decision-focused picture of a site. It combines site-specific measurements with historical, regulatory, and geospatial datasets to support planning and risk assessment.
Why is documenting data gaps important?
Documenting data gaps is critical because undocumented assumptions can invalidate planning decisions and create legal liability. The ASTM E1527-21 framework requires explicit recording of gaps and their potential impact on recognised environmental conditions.
How does 3D visualisation support site data analysis?
3D visualisation allows planners to compare development scenarios against parameters such as sunlight, visibility, building massing, and parking demand simultaneously. This makes tradeoffs visible and supports more informed decisions than 2D mapping alone.
What data sources should urban planners use for site analysis?
Urban planners should draw on municipal GIS portals, national land registries, satellite imagery, LiDAR point clouds, utility provider records, meteorological services, and geotechnical databases. Combining these with on-site surveys produces the most complete and accurate site characterisation.