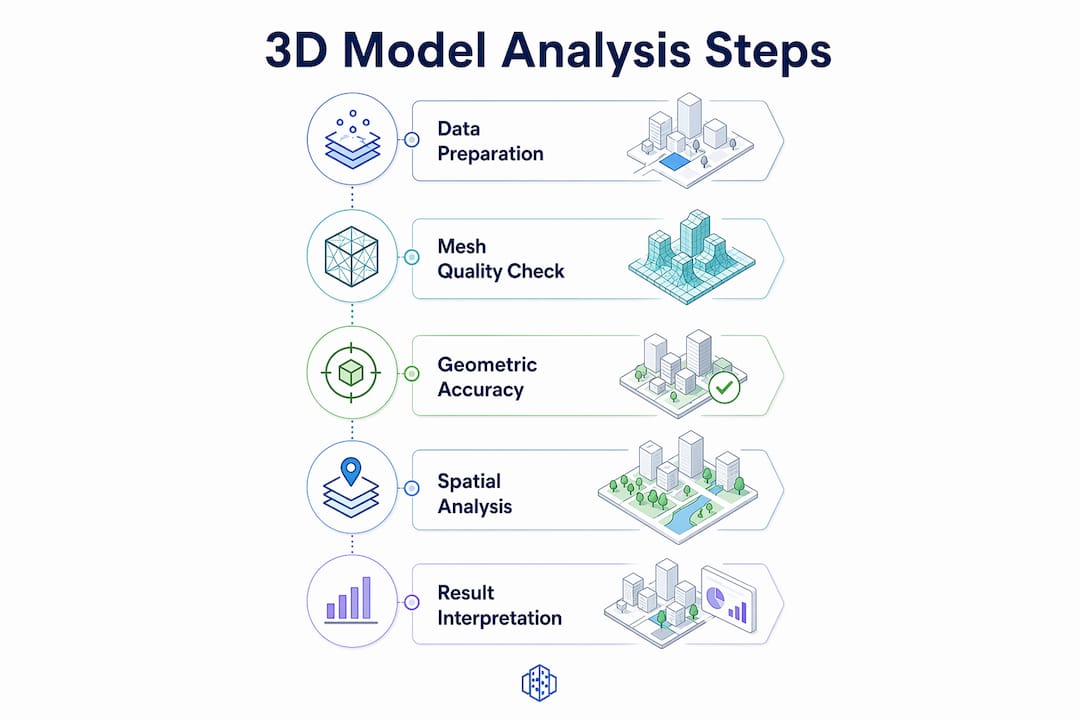
How to analyse 3D models for urban planning

Analysing 3D models in urban planning is defined as the systematic evaluation of geometric accuracy, spatial relationships, environmental performance, and data quality within three-dimensional representations of built environments. Planners, architects, and real estate developers use this process, formally known as 3D spatial model analysis, to assess building volume, height, footprint, sunlight access, shadow patterns, visibility, parking capacity, greenery, and development feasibility. Tools such as Meshmixer, SWAN, CityDPC, Urban Solar Carver, and 3D Cityplanner each address distinct stages of this workflow. Getting the analysis right from the start prevents costly errors in feasibility studies and planning submissions.
How to analyse 3D models: key metrics and quality checks
Geometric accuracy is the foundation of any reliable 3D model analysis. Hausdorff Distance and RMSE are the two primary metrics for measuring surface deviation. Hausdorff Distance captures the worst-case error between two surfaces, while RMSE measures overall deviation across the entire model. Tracking both gives you a complete picture of model quality before any planning calculation begins.
Beyond geometric accuracy, mesh quality determines whether a model is fit for spatial analysis. A watertight mesh has no holes, no non-manifold edges, and no open boundaries. Non-manifold geometry occurs when edges are shared by more than two faces, which breaks ray-tracing algorithms used in visibility and solar studies. Open boundaries leave gaps in surfaces that distort volumetric calculations for building envelopes and floor area ratios.

ISO 19157-1:2023 defines the data quality elements that apply directly to urban spatial datasets: completeness, logical consistency, positional accuracy, and usability. These elements determine whether a dataset is fit for the specific planning calculation you intend to run. A model with high geometric accuracy but incomplete attribute data, such as missing building function classifications, will still fail a zoning feasibility check.
The table below summarises the core metrics and checks used when evaluating 3D models for urban planning purposes.
| Metric or check | Purpose | Planning implication |
|---|---|---|
| Hausdorff Distance | Measures worst-case surface deviation | Flags localised inaccuracies in building facades or rooflines |
| RMSE | Measures overall surface deviation | Indicates general model reliability for volumetric calculations |
| Watertightness | Confirms no holes or open boundaries | Required for accurate floor area and volume computations |
| Non-manifold geometry check | Detects edges shared by more than two faces | Prevents errors in ray-tracing for visibility and solar analysis |
| ISO 19157 completeness | Verifies all required attributes are present | Confirms dataset is fit for zoning and land-use queries |
Pro Tip: Run Meshmixer’s Inspector tool before any spatial analysis. Its Auto Repair All function fixes holes, non-manifold edges, and floating shells in one pass, removing the most common sources of downstream error.
How to perform spatial analyses with 3D models for urban planning
Spatial analysis of 3D urban models covers four core techniques: visibility analysis, shadow and sunlight modelling, vegetation impact assessment, and GIS integration. Each technique answers a specific planning question, from whether a proposed tower blocks a protected sightline to whether a new street receives adequate winter sunlight.
Visibility and line-of-sight analysis uses ray-tracing to determine what can be seen from a given point. In urban planning, this applies to assessing views from public spaces, evaluating the visual impact of new buildings on heritage assets, and verifying compliance with view corridor policies. Ray-tracing fires thousands of rays from an observer point and records which surfaces they intersect. The accuracy of this method depends entirely on mesh integrity, which is why the repair-first principle matters.
Solar and shadow analysis requires a different approach. SWAN, an open-source tool developed at TU Delft, performs high-fidelity shadow analysis directly on CityJSON city models using tessellation and Open3D ray-tracing. It computes shadow durations with fine temporal and spatial granularity. Results integrate with PostGIS, enabling spatial queries such as identifying all streets that receive fewer than two hours of direct sunlight on the winter solstice. Calculating shadows in 3D before GIS integration removes the inaccuracies that come from 2D raster-based shadow methods.
Vegetation geometry changes solar analysis outcomes significantly. An ISPRS study evaluating a 9.24 km² area with 34,617 trees found that including tree geometry in 3D solar models reduces street solar radiation by up to 30% compared to raster GIS methods. That correction matters for pedestrian comfort assessments, urban heat island studies, and solar panel feasibility on building rooftops.
Key spatial analysis outputs for urban planning decisions include:
- Shadow duration maps showing hours of direct sunlight per day across streets, courtyards, and public spaces
- Visibility matrices identifying observer-to-target sightlines for heritage and public realm assessments
- Solar access envelopes defining the maximum buildable volume that preserves sunlight to protected surfaces
- Vegetation shading zones quantifying tree canopy impact on solar radiation at street level
- Line-of-sight compliance reports for planning applications requiring view corridor protection
Pro Tip: Integrate your solar and shadow outputs directly into a PostGIS database. Storing results as spatial layers lets you run queries like “show all parcels where proposed development reduces solar access below the policy threshold” without re-running the full analysis.
What are the workflows and tools for analysing 3D city model data formats?
CityGML and CityJSON are the two standard formats for 3D city models used in urban planning. CityGML is an OGC standard that encodes buildings, terrain, vegetation, and infrastructure with semantic attributes. CityJSON is a lighter JSON-based encoding of the same data model, designed for easier processing in modern software environments. Both formats carry semantic information beyond geometry, including building function, roof type, and surface classification.
CityDPC is an open-source Python tool built specifically for handling CityGML and CityJSON datasets in planning workflows. It validates datasets, detects shared walls between adjacent buildings, and performs geometric computations needed for energy simulations and planning feasibility studies. Semantic and structural consistency, including correct surface classifications and shared-wall detection, is critical for advanced urban energy modelling. A building model where party walls are duplicated rather than shared will produce inflated heat loss calculations.
The table below compares the key tools used in 3D city model analysis workflows.
| Tool | Supported formats | Primary function | Planning application |
|---|---|---|---|
| CityDPC | CityGML, CityJSON | Validation, shared-wall detection, geometric computation | Energy simulation, feasibility analysis |
| SWAN | CityJSON | Shadow duration analysis, PostGIS integration | Solar access, public space evaluation |
| Urban Solar Carver | Custom volume inputs | Voxel carving, solar envelope generation | Maximum buildable volume under solar constraints |
| Meshmixer | STL, OBJ | Mesh inspection and repair | Pre-processing before spatial analysis |
| 3D Cityplanner | GIS, 3D city models | Scenario planning, sunlight, zoning, visibility | Masterplanning, feasibility, stakeholder communication |
Urban Solar Carver uses voxel carving and ray casting to generate the maximum buildable volume that respects solar access constraints over a defined time window. It requires a maximum volume seed, a set of protected surfaces, and a time window as inputs. The output is a precise building envelope that a developer can use directly in a feasibility study, knowing that any design within that envelope will not breach solar access policy.
How to interpret 3D model analysis results for feasibility decisions
Interpreting analysis results correctly is where planning decisions are made or missed. Volumetric outputs from a 3D model tell you the gross floor area, building height, and footprint coverage achievable within zoning constraints. Cross-referencing these figures against local density policies, plot ratio limits, and height planes gives you a buildable programme before a single design drawing is produced.
Infrastructure and parking capacity assessments use 3D spatial data to evaluate whether a site can accommodate the required number of parking spaces, service access routes, and utility connections. A 3D model that includes underground levels, ramps, and structural grids allows planners to test parking layouts against minimum bay dimensions and turning circles in three dimensions, not just on a flat plan.
Greenery and public space analysis results feed directly into planning policy compliance checks. Many local authorities now require minimum green space ratios, tree canopy coverage targets, and public realm quality standards. Measuring these metrics from a 3D model, including canopy spread, ground coverage, and shading contribution, produces evidence that supports planning applications and stakeholder presentations. You can find practical guidance on 3D building modelling workflows that connect model creation to these analysis outputs.
Sunlight and shadow duration data from tools like SWAN and Urban Solar Carver translate directly into feasibility conclusions:
- Solar access compliance: Does the proposed building breach the two-hour sunlight standard for neighbouring gardens or public spaces?
- Occupant comfort: Which facades receive sufficient direct sunlight to meet residential amenity standards?
- Renewable energy potential: Which roof areas receive enough annual solar radiation to justify photovoltaic installation?
- Public realm quality: Do proposed streets and squares meet minimum sunlight hours for outdoor seating and pedestrian comfort?
Presenting these results in a format that non-technical stakeholders can read is as important as producing them. 3D visualisations with colour-coded shadow maps, annotated view corridors, and comparative scenario overlays communicate analysis findings far more effectively than tables of numbers alone. The role of 3D models in architecture and urban planning extends precisely to this communication function.
What are common challenges in analysing 3D models and how to troubleshoot them?
Mesh defects are the most common cause of unreliable analysis results. Small mesh openings and floating shells must be repaired before performing spatial or solar analyses because they create false line-of-sight paths that bias ray-tracing outputs. A single undetected hole in a roof surface can cause a solar analysis to report radiation values that are physically impossible. The repair-first principle is not optional; it is the prerequisite for every downstream computation.
Data completeness and consistency failures are the second most frequent problem. A CityGML dataset missing building height attributes, or one where surface normals point inward rather than outward, will produce incorrect results in energy simulations and shadow analyses. Validating datasets against ISO 19157 quality elements before analysis catches these issues systematically rather than discovering them after hours of computation.
Large city-scale models introduce computational challenges. Processing a full district model with thousands of buildings, detailed vegetation geometry, and underground infrastructure simultaneously can exceed available memory. Tiling the model into manageable zones, processing each zone independently, and merging results in PostGIS is the standard approach for city-scale solar and visibility analyses.
Follow this numbered troubleshooting sequence for typical 3D model analysis problems:
- Run mesh inspection first. Use Meshmixer Inspector to detect holes, non-manifold edges, and floating shells before any analysis.
- Validate data completeness. Check that all required attributes, including building height, function, and surface classification, are present and correctly assigned.
- Check surface normals. Inverted normals cause ray-tracing errors. Flip normals to face outward before running visibility or solar analysis.
- Tile large models. Divide city-scale datasets into spatial tiles to manage memory and processing time.
- Cross-check outputs against known values. Compare shadow duration results for a simple test building against a manual calculation before trusting district-scale outputs.
- Document your repair log. Record every change made to the original dataset so that analysis results can be traced back to a specific model version.
Pro Tip: Keep a clean, unmodified copy of every source dataset. Repairs and transformations should always be applied to a working copy. This protects the integrity of your audit trail for planning submissions.
Key takeaways
Reliable 3D model analysis for urban planning requires a repair-first approach to mesh integrity, systematic quality checks against ISO 19157, and the integration of spatial, solar, and volumetric outputs into planning decisions.
| Point | Details |
|---|---|
| Repair meshes before analysis | Fix holes, non-manifold geometry, and floating shells using Meshmixer Inspector before any spatial or solar computation. |
| Apply ISO 19157 quality checks | Validate completeness, logical consistency, and positional accuracy to confirm datasets are fit for planning use. |
| Include vegetation in solar models | Tree geometry reduces street solar radiation by up to 30%, correcting significant underestimates from raster GIS methods. |
| Use voxel carving for feasibility | Urban Solar Carver generates maximum buildable envelopes that respect solar access constraints for development feasibility. |
| Integrate results into GIS | Store shadow, visibility, and volumetric outputs in PostGIS to run spatial queries that directly support planning decisions. |
Why I think most planning teams analyse 3D models in the wrong order
The most consistent mistake I see in urban planning practices is running spatial analysis on models that have not been validated. Teams invest days in solar studies and visibility assessments, then discover the underlying mesh had open boundaries throughout. Every result produced before that repair is unreliable. The repair-first principle sounds obvious, but the pressure to produce results quickly means it gets skipped more often than it should.
What has genuinely changed planning outcomes in my experience is integrating vegetation geometry into solar models from the start, not as an afterthought. The ISPRS research on 34,617 trees across a 9.24 km² area confirmed what I had observed in practice: traditional raster GIS methods consistently underestimate tree shading. That underestimation leads to overoptimistic solar access assessments for new residential developments, which then fail at appeal.
The choice of software platform matters more than most teams acknowledge. CityDPC handles CityGML and CityJSON validation well for technical workflows. SWAN produces credible shadow analysis outputs. But neither replaces a platform that combines GIS data, scenario comparison, and stakeholder-ready visualisation in a single environment. The gap between technical analysis and communicable results is where planning decisions actually get made.
The future of 3D model analysis in urban planning sits in tighter integration between open-source analysis tools and browser-based platforms that non-specialists can use. Standards like ISO 19157 will become baseline requirements rather than optional quality checks as digital twin adoption grows across municipalities. Teams that build these workflows now will be significantly better positioned when those requirements become mandatory.
— Anne Dullemond
3D Cityplanner: browser-based analysis for urban development teams
3D Cityplanner is a browser-based digital twin platform that combines GIS data, 3D city models, and scenario planning tools in one environment. Planners and developers use it to analyse building volume, sunlight access, shadow patterns, visibility, parking capacity, greenery, and development capacity without installing specialist software.
The platform supports early-stage feasibility studies, masterplanning, and stakeholder communication by making analysis results visible and comparable across multiple scenarios. For teams working on site evaluation or redevelopment projects, 3D Cityplanner connects the technical outputs of 3D model analysis directly to planning decisions. You can explore the platform’s zoning analysis tools or request a demo at 3dcityplanner.com/en/demo to see how it fits your workflow.
FAQ
What is 3D model analysis in urban planning?
3D model analysis in urban planning is the systematic evaluation of geometric accuracy, spatial relationships, environmental performance, and data quality within three-dimensional city models. It covers building volume, height, sunlight, shadow, visibility, and infrastructure to support feasibility studies and planning decisions.
Which metrics are used to evaluate 3D model accuracy?
Hausdorff Distance measures worst-case surface deviation and RMSE measures overall deviation. Both metrics together give a complete assessment of geometric accuracy before any planning calculation is run.
Why must mesh defects be repaired before spatial analysis?
Mesh defects such as holes, non-manifold edges, and floating shells create false line-of-sight paths that bias ray-tracing outputs in visibility and solar analyses. Repairing the mesh first, using a tool like Meshmixer Inspector, prevents systematic errors from propagating through every downstream result.
How does vegetation affect 3D solar analysis results?
Including tree geometry in 3D solar models reduces calculated street solar radiation by up to 30% compared to raster GIS methods. Omitting vegetation leads to overoptimistic solar access assessments that may not survive planning scrutiny.
What formats are used for 3D city models in planning workflows?
CityGML and CityJSON are the standard formats for 3D city models in urban planning. CityDPC is an open-source Python tool that validates, manipulates, and analyses datasets in both formats, including shared-wall detection needed for energy simulations.