Energy modelling in urban planning: a practical guide

Energy modelling in urban planning is the practice of simulating energy flows across buildings, streets, and districts to predict consumption, reduce demand, and inform sustainable urban design from the earliest project stages. Known formally as Urban Building Energy Modelling (UBEM), it combines building physics, GIS data, 3D city geometry, and microclimate analysis to give planners, architects, and developers a quantified basis for design decisions. Tools such as EnergyPlus, GIS-AWBEM, and browser-based platforms like 3D Cityplanner bring this analysis into practical workflows, replacing guesswork with spatial evidence. The result is faster feasibility assessment, better energy performance, and stronger stakeholder communication across every scale of urban development.
How does energy modelling in urban planning work?
UBEM simulates how the physical form of a city affects energy demand. It draws on three data layers: building geometry, thermal properties of envelopes and materials, and local climate conditions. Each layer contributes to a picture of how much energy a district will consume under different design scenarios.
The geometry layer typically comes from GIS datasets or 3D city models. Thermal properties describe insulation values, window ratios, and HVAC systems. Climate data provides temperature, solar radiation, wind speed, and humidity. When these layers combine in a simulation engine, planners can test how a proposed masterplan performs before a single foundation is dug.

The distinction between UBEM and single-building energy modelling is scale. UBEM accounts for interactions between buildings, including mutual shading, shared infrastructure loads, and district-level renewable energy potential. That systemic view is what makes it genuinely useful for urban planning decisions.
How do building orientation, density, and shading affect energy demand?
The physical arrangement of buildings is the single largest driver of urban energy demand variation. Three spatial factors dominate: orientation, density, and shading.
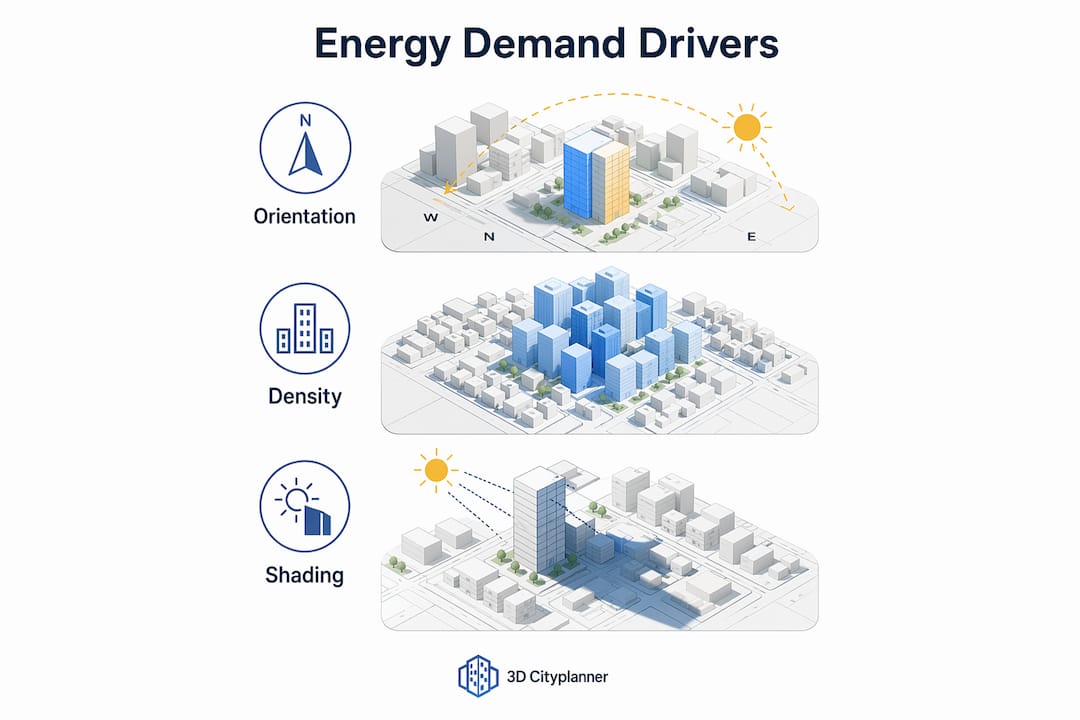
Building orientation determines how much solar radiation a façade receives throughout the day. A south-facing residential block in northern Europe captures significantly more passive solar heat in winter, reducing heating loads. Rotating the same block 90 degrees can increase annual heating demand considerably, depending on glazing ratios and insulation standards.
Building density affects energy in two ways. Higher density reduces the exposed surface area per dwelling, which lowers heat loss. At the same time, dense urban canyons create shading patterns that reduce solar gain and alter wind flow. The net effect on energy demand depends on the specific morphology, which is why modelling each scenario matters.
Shading from neighbouring buildings and vegetation directly cuts cooling loads in summer but can increase heating loads in winter. A tall building casting shade on a lower residential block may reduce that block’s cooling demand by a meaningful margin while adding to its winter heating requirement. Vegetation provides seasonal shading that partially mitigates this trade-off.
- South and south-east orientations maximise passive solar gain in northern climates.
- Compact urban blocks reduce heat loss through shared walls and reduced surface-to-volume ratios.
- Street canyon geometry affects wind-driven ventilation and natural cooling potential.
- Tree canopy placement can reduce summer cooling loads without significantly increasing winter heating demand.
Pro Tip: When evaluating a masterplan layout, run orientation sensitivity tests across at least three building rotation scenarios before fixing the block structure. The energy differences can be substantial and are far cheaper to address at concept stage than after planning consent.
Why does microclimate data matter for urban energy analysis?
Standard meteorological data, typically recorded at airport weather stations outside urban areas, does not capture the thermal conditions that buildings in a city actually experience. Urban environments generate their own microclimates through heat island effects, altered wind corridors, and localised humidity variations. Using generic weather data in a UBEM simulation produces results that misrepresent actual energy demand.
Microclimate-integrated UBEM shows that energy use intensity prediction varies between -8% and +2.9% when accounting for local microclimate versus generic weather data. That range is large enough to change the viability of a renewable energy system or the sizing of an HVAC installation.
Recent automated frameworks address this by downscaling climatic data to urban morphology, unifying geometric, meteorological, and non-geometric datasets to identify climate-sensitive zones within a district. This means a dense inner-city block and a suburban edge site can each receive climate inputs that reflect their actual exposure conditions.
| Microclimate factor | Effect on energy demand | Modelling approach |
|---|---|---|
| Urban heat island | Increases cooling loads, reduces heating loads | Downscaled temperature data per urban zone |
| Wind corridors | Affects infiltration and natural ventilation potential | CFD or simplified wind modelling |
| Localised shading | Reduces solar gain on lower floors | 3D shadow analysis from city model |
| Humidity variation | Influences latent cooling loads | Site-specific humidity profiles |
Pro Tip: If your project sits within a dense urban area, request or generate a local climate file rather than using the nearest national weather station dataset. The accuracy gain is worth the additional data preparation time.
GIS-based 3D city modelling and automated energy workflows
GIS platforms and open data sources have made district-scale energy modelling far more accessible. Frameworks such as GIS-AWBEM automate the construction of Level of Detail 1 (LOD1) building models directly from OpenStreetMap and OpenTopography datasets, removing the need for manual 3D model creation for every building in a study area.
GIS-AWBEM uses EnergyPlus as its single simulation engine, providing detailed HVAC and thermal mass modelling under an open-source modular framework. Avoiding multi-software integration reduces errors and speeds up district-scale energy performance evaluations considerably.
The automation workflow typically follows these steps:
- Data acquisition. Pull building footprints, heights, and land use from OpenStreetMap or a national cadastre. Supplement with OpenTopography data for terrain and shading context.
- Model generation. Use GIS-AWBEM or a comparable framework to generate LOD1 building volumes automatically, assigning default thermal properties by building type and age.
- Parameter refinement. Adjust envelope data, window-to-wall ratios, and HVAC assumptions for key buildings where detailed information is available. Automated frameworks require this manual step because open GIS datasets rarely capture thermal envelope detail.
- Simulation. Run EnergyPlus across the district model to generate energy use intensity outputs per building and per zone.
- Visualisation. Map results back onto the 3D city model to communicate findings to stakeholders and support iterative design changes.
The benefits of 3D city models extend beyond simulation accuracy. Visualising energy performance in three dimensions makes findings legible to non-technical stakeholders, including elected members, community groups, and investors. A colour-coded energy intensity map of a proposed district communicates far more than a spreadsheet of kilowatt-hour figures.
How to integrate energy modelling into early-stage urban design
The most common mistake in urban energy analysis is treating it as a post-design validation exercise. By the time a masterplan layout is fixed, the decisions that most influence energy demand, including block orientation, density, public space configuration, and infrastructure routing, have already been made. Embedding UBEM during concept and feasibility stages changes the outcome.
Frameworks for Positive Energy Districts detail over 50 urban design elements that balance technical energy performance with social outcomes. That breadth reflects the reality that energy modelling at the district scale is not purely a technical exercise. It intersects with thermal comfort, affordability, climate adaptation, and community well-being.
A practical early-stage integration process works as follows:
- Define the energy brief. Set targets for energy use intensity, renewable energy share, and carbon performance at district level before any geometry is fixed.
- Generate massing options. Create three to five block layout alternatives in a 3D scenario tool, varying orientation, height, and density.
- Run rapid energy screening. Apply simplified UBEM to each massing option to identify which layouts perform best against the energy brief.
- Evaluate trade-offs. Assess each option against socio-technical factors including equity, comfort, and affordability alongside energy metrics.
- Iterate with stakeholders. Use 3D visualisations to present scenario comparisons to project partners and communities, collecting feedback that feeds back into the model.
- Refine and commit. Select the preferred layout with documented energy evidence, then proceed to detailed design with a validated performance baseline.
3D Cityplanner supports this workflow by enabling planners and developers to design, compare, and analyse spatial scenarios in a browser-based 3D environment. Its GIS data integration and scenario comparison features make it well suited to the iterative, evidence-based process that early-stage energy modelling requires. Exploring 3D scenario analysis at concept stage gives teams the spatial evidence they need before committing to a layout.
Energy modelling also needs to account for infrastructure beyond buildings. Future urban energy efficiency depends on viewing buildings as nodes in coupled networks that include transport systems and power grids. A district that performs well in isolation may create grid stress or miss opportunities for shared renewable energy generation if the wider infrastructure context is ignored.
Key takeaways
Embedding energy modelling at the concept stage of urban design produces better outcomes than using it as a post-design check.
| Point | Details |
|---|---|
| Start modelling early | Run UBEM during concept and feasibility stages, not after the masterplan layout is fixed. |
| Use local microclimate data | Generic weather station data misrepresents urban conditions; downscaled microclimate inputs improve prediction accuracy. |
| Automate with GIS workflows | Frameworks like GIS-AWBEM generate LOD1 models from open data, reducing manual effort at district scale. |
| Refine thermal parameters manually | Automated models need custom envelope data for key buildings to produce reliable energy use intensity figures. |
| Assess socio-technical outcomes | Evaluate energy performance alongside comfort, affordability, and equity for district-scale planning decisions. |
Energy modelling in practice: what I have learned
The gap between what energy models promise and what they deliver in practice usually comes down to one thing: data quality. I have seen projects where planners trusted automated GIS-to-energy workflows without checking the underlying building parameters. The outputs looked authoritative. The assumptions were generic. The resulting energy figures were off by enough to affect infrastructure sizing decisions.
The fix is not to abandon automation. GIS-AWBEM and similar frameworks are genuinely useful for screening large areas quickly. The discipline is knowing where the model needs human input. Thermal envelope data, occupancy profiles, and HVAC assumptions rarely survive intact from an open dataset. Someone with building physics knowledge needs to review and adjust them for the specific building stock in the study area.
The other pattern I have observed is treating energy models as internal technical documents rather than communication tools. A 3D visualisation of energy intensity across a proposed district, presented interactively to a planning committee or community group, does more to build project consensus than a technical report. The model becomes a shared reference point rather than a consultant’s deliverable.
Looking ahead, the most significant shift will be sector coupling. Buildings, transport, and power grids are increasingly interdependent, and energy models that treat a district in isolation will miss the most important efficiency opportunities. Planners who start building familiarity with integrated urban energy networks now will be better placed as these frameworks mature.
— Anne Dullemond
3D Cityplanner and urban energy scenario analysis
Urban energy analysis produces its greatest value when planners can test spatial alternatives quickly and communicate findings clearly to all project partners.
3D Cityplanner is a browser-based digital twin platform that combines GIS data, 3D city models, and scenario comparison tools in a single environment. Planners and developers can generate massing alternatives, analyse sunlight and shading, and compare development scenarios side by side without switching between software packages. The platform integrates with GIS-based energy modelling outputs, making it practical for early-stage feasibility studies and masterplanning where energy performance is a design constraint. Teams working on Positive Energy Districts, redevelopment projects, or large-scale masterplans can use 3D Cityplanner to test spatial decisions against energy and sustainability targets before committing to a layout. A free trial or demo is available for teams ready to bring 3D scenario analysis into their energy planning workflow.
FAQ
What is urban building energy modelling (UBEM)?
Urban building energy modelling (UBEM) is the simulation of energy flows across multiple buildings and districts using combined GIS geometry, building physics data, and climate inputs. It differs from single-building energy modelling by accounting for interactions between buildings, including shading, shared infrastructure, and district-level renewable potential.
How accurate is energy modelling at the urban scale?
Accuracy depends heavily on input data quality. Microclimate-integrated UBEM shows energy use intensity predictions vary between -8% and +2.9% compared to models using generic weather data, which is a meaningful difference for infrastructure sizing and renewable energy planning.
What open data sources support urban energy modelling?
OpenStreetMap provides building footprints and heights, while OpenTopography supplies terrain data. Frameworks like GIS-AWBEM use these sources to generate LOD1 building models automatically, though thermal envelope parameters typically require manual refinement for reliable results.
When should energy modelling be introduced in a planning project?
Energy modelling should be introduced during concept and feasibility stages, before block layouts and orientations are fixed. Positive Energy District frameworks confirm that early integration allows planners to balance energy performance with social and climate adaptation outcomes across more than 50 urban design variables.
Can energy modelling support stakeholder engagement?
Yes. Interactive energy scenarios linking spatial design changes to energy outcomes build project consensus more effectively than static technical reports. 3D visualisations of energy intensity across a proposed district make performance data legible to non-technical audiences including planning committees and community groups.
Recommended
- What is urban scenario modelling for planners? – 3D Urban Development
- Master urban space modelling with advanced 3D tools in 2026 – 3D Urban Development
- 3d Building Modeling Tutorial for Efficient Urban Planning – 3D Urban Development
- Urban Environment Simulation: Enhancing City Planning – 3D Urban Development