Spatial datasets explained for urban planners

Spatial datasets are collections of information tied to a specific physical location on or near the Earth’s surface, stored using coordinate systems and attributes that describe what exists at each location. Ordnance Survey defines them as data that associates variables or features with a geographic position, enabling analysis of patterns that are simply invisible in a conventional spreadsheet. For urban planners, that spatial dimension is what makes the difference between knowing a site exists and understanding how it relates to everything around it.
Two immediate applications illustrate why this matters in practice:
- Site analysis: spatial datasets let you query proximity to public transport, check zoning boundaries, and identify flood-risk overlaps before a single drawing is produced.
- 3D modelling: LiDAR point clouds and elevation rasters supply the Z-coordinate data that feeds building massing, sunlight modelling, and visibility analysis in platforms such as 3D Cityplanner.
ISO/TC 211 formalises the concept, defining geographic data as information with an implicit or explicit association to a location relative to Earth. In practice, you will hear the terms geospatial data, georeferenced data, and geographic information used interchangeably with spatial datasets.
Key takeaways
Spatial datasets are the foundation of reliable urban planning analysis: the data model, CRS, and source quality you choose at the start determine the accuracy of every calculation that follows.
| Point | Details |
|---|---|
| Definition | Spatial datasets tie attributes to geographic coordinates, enabling analysis of patterns invisible in tabular data. |
| Vector vs raster | Use vector for discrete objects (parcels, roads, buildings) and raster for continuous fields (elevation, imagery). |
| UK CRS standard | Reproject all layers to British National Grid (EPSG:27700) before running any UK spatial analysis or 3D modelling. |
| Authoritative UK sources | Ordnance Survey, Environment Agency LiDAR, ONS Geoportal, and data.gov.uk are the primary sources for planning-grade data. |
| 3D Cityplanner | Ingests GIS layers, point clouds, and 3D city models in a browser-based platform for scenario comparison and stakeholder visualisation. |
Table of Contents
- What makes data “spatial” — geometry, attributes, and relationships
- Vector versus raster: which data model should you use?
- Specialist dataset types: point clouds, LiDAR, multi-temporal, and network data
- Common file formats and spatial data structures
- Coordinate reference systems: WGS84 versus British National Grid
- Where to find authoritative UK spatial datasets
- How to choose the right spatial dataset for your project
- Tools and short workflows to start using spatial datasets
- How spatial datasets feed real urban planning workflows
- Quick-start checklist for your first UK spatial dataset project
- Licensing nuances beyond the Open Government Licence
- Why the data model decision matters more than the tool
- 3D Cityplanner puts your spatial datasets to work immediately
- Sources
- FAQ
What makes data “spatial” — geometry, attributes, and relationships
Ordinary data becomes spatial the moment a geometry is attached. Geometry describes where something is: a point (a pair of X, Y coordinates), a line (an ordered sequence of coordinate pairs), or a polygon (a closed ring of coordinates). Attributes sit alongside the geometry in a table and describe what that feature is — its name, classification, area, height, or any other non-spatial property.
| Geometry type | Planning example | Key attribute fields |
|---|---|---|
| Point | Street lamp post | Asset ID, wattage, install date |
| Line | Road centreline | Road name, speed limit, surface type |
| Polygon | Land parcel | UPRN, land use class, area (m²) |
The real power of spatial datasets comes from the questions you can ask once geometry and attributes are combined. Planners routinely run:
- Buffer/proximity queries: which residential parcels fall within 400 m of a proposed development?
- Intersection queries: which planning zones overlap a flood-risk area?
- Containment queries: how many listed buildings sit within a conservation area boundary?
- Network routing: what is the walking distance from a site to the nearest primary school?
GIS processes these relationships to reveal spatial context that supports decision-making across urban planning, transport, and environmental management.
Pro Tip: Before using any dataset, open its metadata record and check for a coordinate reference system (CRS) entry. A dataset with no CRS stated is effectively ungeoreferenced — it cannot be overlaid reliably with other layers until the projection is confirmed or assigned.
Vector versus raster: which data model should you use?
Two primary structures underpin most spatial datasets: vector and raster. Choosing the wrong one early in a project creates inefficiencies that compound through every subsequent analysis step.
Vector stores geometry explicitly as coordinate pairs, with an accompanying attribute table. A building footprint polygon, a road network, or a set of tree locations are all naturally vector phenomena — they represent discrete, bounded objects. Common formats include Shapefile and GeoJSON.
Raster divides the study area into a regular grid of equally sized cells, each holding a single value. Elevation models, satellite imagery, and land-surface temperature maps are naturally raster phenomena — they represent continuous fields that vary across space. Each cell value represents the average or estimated value for that cell area, so spatial resolution (cell size) is a core consideration: a 1 m digital elevation model captures kerb-level detail; a 25 m model does not.
Conversion between the two is possible but always involves trade-offs. Rasterising a vector building footprint, for instance, introduces staircase edges and loses sub-cell precision. Vectorising a raster land-cover classification generalises boundaries. Documenting conversion parameters and running sample checks is good practice before committing converted data to a feasibility calculation.
Use this decision flow for common planning tasks:
- Land-use mapping (discrete zones): vector polygons with classification attributes.
- Elevation or slope analysis: raster DEM; cell size matched to required precision.
- Asset inventory (lamp posts, trees, utilities): vector points with attribute tables.
- Aerial or satellite imagery overlay: raster GeoTIFF or COG (Cloud-Optimised GeoTIFF).
- Flood-risk modelling: raster for continuous depth values; vector for flood-zone boundaries.
Specialist dataset types: point clouds, LiDAR, multi-temporal, and network data
Beyond the vector/raster split, several specialist dataset types are central to urban modelling and digital twins.
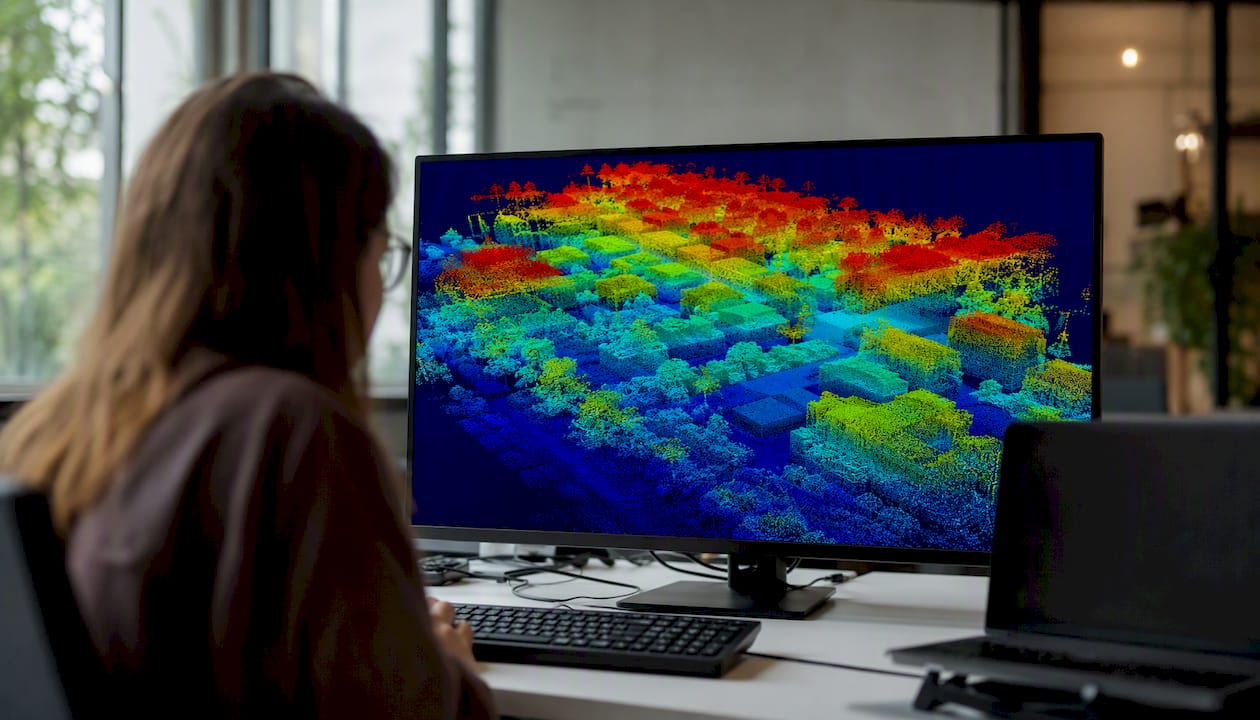
3D point clouds and LiDAR add a Z coordinate to every measured point, giving planners true three-dimensional information about the built and natural environment. LiDAR provides elevation data used for visibility, sunlight modelling, and 3D city modelling. In practice, a LiDAR survey of a city block can resolve individual roof pitches, tree canopy heights, and ground-level topography simultaneously. The standard formats are LAS (uncompressed) and LAZ (compressed), with LAZ typically reduces file size significantly while retaining full precision. Point clouds are large: a single urban tile at 10 points/m² can run to several gigabytes, so processing pipelines and storage need planning before acquisition.
Pro Tip: When accuracy matters for height-sensitive analyses such as sunlight or flood modelling, prefer the raw point cloud over a derived surface model. Derived products (DSMs, DTMs) involve interpolation choices that may smooth away detail critical to your calculation.
Multi-temporal datasets capture the same area at different points in time. Change-detection workflows compare two or more epochs of aerial imagery or LiDAR to identify new construction, vegetation loss, or land-use shift. For urban planners monitoring redevelopment sites or tracking green-infrastructure change, infrastructure mapping with 3D and 4D technologies extends this into four-dimensional analysis.
Network datasets model connectivity rather than simple geometry. A transport network dataset encodes nodes (junctions) and edges (road segments) with attributes such as travel time, speed limit, and mode restrictions. Utility networks add directionality and capacity. These datasets underpin accessibility analysis, catchment modelling, and infrastructure capacity checks.
Common file formats and spatial data structures
Knowing which format a dataset arrives in determines how quickly you can open it, what tools you need, and whether attributes survive the transfer intact.
| Format | Geometry types | Attributes | Typical use | Interoperability note |
|---|---|---|---|---|
| Shapefile (.shp) | Point, line, polygon | Yes (.dbf) | Legacy GIS exchange | Field names capped at 10 characters; requires 4+ sidecar files |
| GeoJSON | Point, line, polygon | Yes | Web APIs, lightweight exchange | Human-readable; poor performance with large files |
| GeoTIFF | Raster | Band values | Imagery, DEMs | Widely supported; embed CRS in file header |
| GeoPackage (.gpkg) | All vector + raster | Yes | Modern single-file exchange | SQLite-based; no field-name limits |
| LAS / LAZ | 3D point cloud | Yes (classification, intensity) | LiDAR, photogrammetry | LAZ is compressed LAS; use PDAL or LAStools to process |
| PostGIS | All vector + raster | Yes | Scalable database storage | Requires PostgreSQL; supports spatial indexing and complex queries |
GeoJSON is widely adopted for web delivery, and web services (WMS for imagery, WFS for vector features, REST APIs for tiles) let you stream data directly into a GIS without downloading large files.
For conversion and inspection, the core toolkit is:
- QGIS: open-source desktop GIS for visualisation, reprojection, and format conversion via the Processing toolbox.
- GDAL/OGR (ogr2ogr): command-line library for batch conversions between virtually any vector or raster format.
- PostGIS: spatial extension for PostgreSQL; handles large datasets and complex spatial queries at scale.
- PDAL: point cloud processing library for LAS/LAZ workflows.
Pro Tip: Shapefile’s 10-character field name limit silently truncates longer attribute names during export, which can corrupt joins and lookups downstream. For any new project, prefer GeoPackage or GeoJSON — both support full-length field names and travel as a single file.
Coordinate reference systems: WGS84 versus British National Grid
A coordinate reference system (CRS) defines how coordinates map onto the real surface of the Earth. Two datasets with different CRS settings will appear misaligned when overlaid, producing invalid area, distance, and intersection results — a common source of errors in feasibility studies and 3D models.
Two CRS settings dominate UK planning work:
- WGS84 (EPSG:4326): the global geographic coordinate system used by GPS devices and most web mapping APIs. Coordinates are in decimal degrees (latitude/longitude). Use this when receiving data from GPS surveys, OpenStreetMap exports, or international sources.
- British National Grid (EPSG:27700): the projected coordinate system used by Ordnance Survey for all UK national mapping. Coordinates are in metres (Eastings/Northings), making area and distance calculations straightforward and accurate across Great Britain.
CRS mismatch warning: Overlaying a WGS84 layer with a British National Grid layer without reprojection produces coordinate offsets of hundreds of metres across the UK. Area calculations on an unprojected WGS84 layer in degrees are meaningless for planning purposes. Always reproject to a single project CRS before running any spatial analysis or building a 3D city model.
A simple reprojection workflow:
- Open the dataset in QGIS and check the CRS in Layer Properties.
- If the CRS is not EPSG:27700 (for UK work), use Reproject Layer (Processing toolbox) to convert.
- Verify the output by checking that Easting/Northing values fall within expected UK ranges (Eastings 0–700,000; Northings 0–1,300,000).
- For 3D work, also confirm the vertical datum: Ordnance Datum Newlyn (ODN) is the standard for UK height data; GPS ellipsoidal heights require a OSTN15/OSGM15 transformation to convert to ODN.
Where to find authoritative UK spatial datasets
The UK has a well-developed ecosystem of open and licensed spatial data. These are the primary sources for planning work:
- Ordnance Survey: national mapping agency; products range from OS OpenData (free under OGL) to OS MasterMap (licensed, high-precision topography updated continuously). The definitive baseline for UK site analysis.
- data.gov.uk: central open data portal for UK government datasets; covers planning applications, transport, environment, and administrative boundaries.
- ONS Geoportal (geoportal.statistics.gov.uk): statistical geographies (LSOAs, MSOAs, local authority boundaries) linked to census and deprivation data; essential for socio-economic context layers.
- Environment Agency: primary source for LiDAR surveys and flood-risk and elevation datasets across England; most products are free under OGL.
- EDINA Digimap: academic subscription service providing curated OS, historic, aerial, and LiDAR collections; the standard access route for university-based planning research.
- OpenStreetMap: community-maintained global dataset; useful for base maps, street networks, and points of interest in preliminary analysis. Licence is ODbL (Open Database Licence), which requires attribution and share-alike for derivative databases.
Licence notes. Most OS OpenData and government datasets are published under the Open Government Licence (OGL), which permits free use, adaptation, and redistribution with attribution. OS MasterMap and premium products require a commercial licence. Always read the licence terms before using data in a deliverable or published model — particularly for derivative works.
Currency matters. OS MasterMap receives continuous updates; OpenStreetMap activity varies by area and can lag significantly in rural or recently developed zones. For regulatory submissions, always use the most current authoritative dataset and record the download date in your project metadata.
How to choose the right spatial dataset for your project
Selecting a dataset is a decision with downstream consequences. Work through these questions before committing:
- What question are you answering? Proximity analysis needs different precision than a zoning overlay or a sunlight study.
- What spatial resolution or geometric precision do you need? A 1 m LiDAR DEM for flood modelling; a 25 m raster for regional land-cover context.
- How current does the data need to be? Planning applications require up-to-date topography; a feasibility sketch may tolerate older data.
- What is the geographic coverage? National datasets (OS) cover Great Britain consistently; local authority datasets may have gaps.
- Which CRS does your project use? Prefer EPSG:27700 for UK work and reproject everything to match.
- What attributes do you need? A road network without speed-limit attributes cannot support accessibility modelling.
- What are the licence constraints? OGL data can be used in client deliverables; some OS products cannot be shared externally without a sub-licence.
- What file format does your platform accept? Check before downloading a 10 GB Shapefile that needs converting.
A realistic example: for a small urban redevelopment site in a UK city, a typical dataset stack might include OS MasterMap Topography Layer for precise building footprints and boundaries, Environment Agency 1 m LiDAR for elevation and flood-risk context, and OpenStreetMap for the surrounding street network in early-stage sketches where budget is constrained. Before loading any of these into a 3D model or feasibility calculation, check each dataset’s accuracy statement in its metadata record.
Tools and short workflows to start using spatial datasets
Getting from a raw download to a usable layer in a planning model takes fewer steps than many practitioners expect. A practical starting workflow:
- Acquire data from an authoritative source (OS, Environment Agency, ONS Geoportal) and note the download date and licence.
- Inspect metadata in QGIS (Layer Properties) or via the dataset’s accompanying XML/JSON metadata file; confirm CRS, resolution, and attribute definitions.
- Reproject and clean using QGIS’s Reproject Layer tool or
ogr2ogr -t_srs EPSG:27700; remove null geometries and fix topology errors. - Combine layers by running a spatial join or overlay in QGIS or PostGIS to bring together the attributes you need.
- Export for your platform in the required format (GeoPackage for QGIS projects, GeoJSON for web tools, LAS/LAZ for point-cloud workflows).
GIS processes these datasets to extract the spatial context that informs planning decisions. For teams building 3D city models, the same workflow applies: clean, reprojected layers load reliably; unverified data causes misaligned geometry and unreliable outputs.
When working with web services, WMS streams raster tiles directly into QGIS without a local download — useful for OS base maps and aerial imagery. WFS delivers vector features on demand. For large rasters or dense point clouds, streaming is preferable to downloading the full dataset, particularly during early-stage exploration.
Pro Tip: When preparing large rasters or point clouds for a digital twin, tile the data into manageable chunks (e.g. 1 km × 1 km), generate a lower-resolution preview for initial loading, and use LAZ compression for point clouds. This reduces memory load and speeds up first-pass visualisation without discarding full-resolution data.
How spatial datasets feed real urban planning workflows
The practical value of spatial datasets becomes clear when you trace them through specific planning tasks.
Site analysis and accessibility. A vector polygon of a proposed development site, overlaid with OS MasterMap parcels, planning zone boundaries, and a transport network dataset, answers questions about permitted use, neighbouring land uses, and walking-distance catchments in minutes. The site analysis capabilities that planners need most — proximity, zoning, and accessibility — all depend on well-prepared, correctly projected vector datasets.
Sunlight and shadow modelling. Accurate sunlight analysis requires building height data (from LiDAR or a 3D city model) combined with the site’s geographic coordinates. A 1 m LiDAR DEM resolves roof geometry well enough to model overshadowing on adjacent gardens and public spaces. Using a 5 m DEM for the same task introduces errors that can misrepresent compliance with daylight standards.
Visibility and line-of-sight. Viewshed analysis uses a raster elevation model to calculate which areas are visible from a given point. This feeds directly into design decisions about building height, public realm quality, and heritage impact assessments.
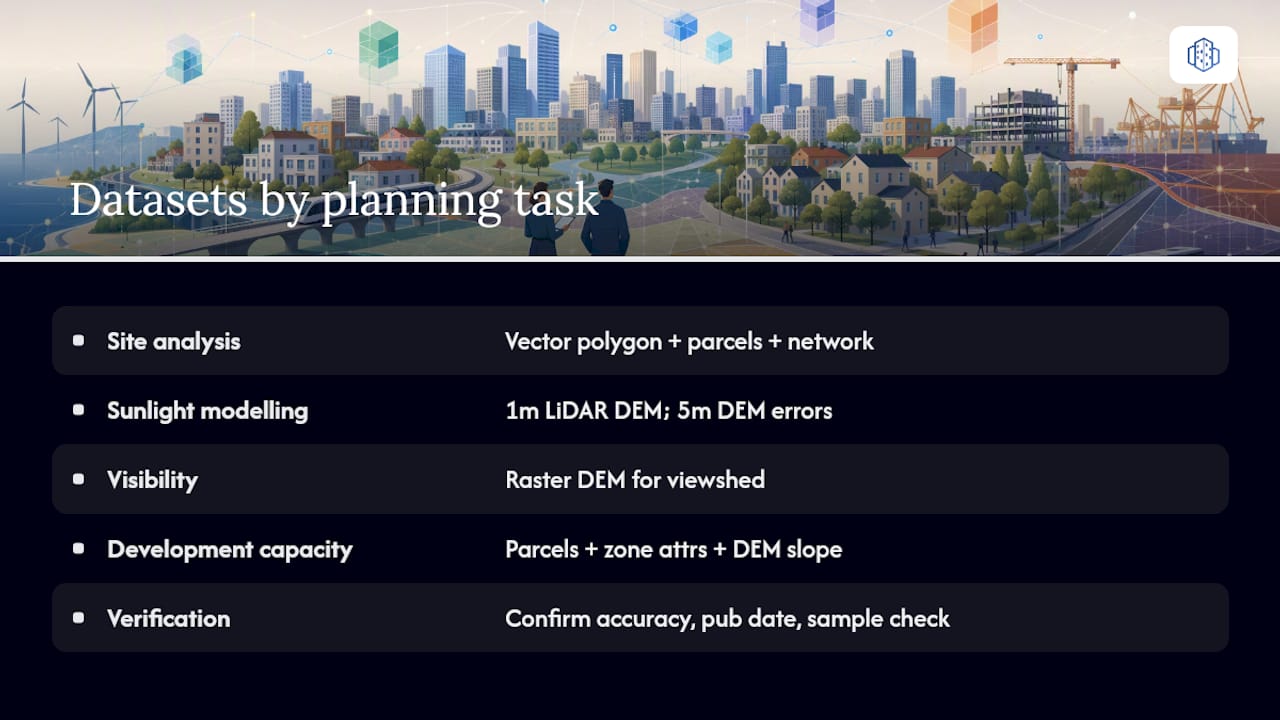
Development capacity and zoning checks. Vector parcel data with planning-zone attributes, combined with a raster DEM for slope constraints, supports rapid development capacity calculations. 3D Cityplanner ingests GIS layers and 3D city models to run scenario comparisons and stakeholder visualisations in a browser, without requiring local GIS software on every team member’s machine.
Data quality directly affects model reliability. A building footprint dataset that is 18 months out of date on a site with recent demolitions will produce a 3D model that misrepresents the current context. A small validation check — comparing a sample of dataset measurements against a recent site visit or aerial photograph — before committing data to a feasibility calculation is time well spent.
Verification principle: Spatial datasets are only as reliable as their source and their age. Before using any dataset for a regulatory submission or a client-facing feasibility study, confirm the data’s accuracy statement, check the publication date, and run at least one sample measurement against a known ground-truth value.
Quick-start checklist for your first UK spatial dataset project
Follow these steps to move from a planning question to a working spatial model:
- Define your question and study area. What decision does the spatial analysis need to support? Set a bounding box or administrative boundary.
- List the layers you need and their required CRS. For UK work, default to EPSG:27700 unless a specific reason requires otherwise.
- Obtain data from authoritative sources. Start with OS OpenData, Environment Agency LiDAR, and ONS Geoportal for administrative boundaries.
- Check metadata and licence. Confirm CRS, accuracy, publication date, and whether the licence permits your intended use.
- Prepare and reproject. Clean null geometries, reproject all layers to your project CRS, and standardise attribute field names.
- Run a simple overlay or proximity analysis. Validate the output against known values before building further.
- Export for your platform or model. Use GeoPackage for QGIS, GeoJSON for web tools, or the platform’s native import format for digital twins.
For teams new to spatial data, the 3D city modelling guide provides a practical walkthrough of converting prepared datasets into a 3D planning model. Expect the first import to take longer than subsequent ones: metadata checking and CRS verification are the steps most often skipped and most often responsible for errors.
Licensing nuances beyond the Open Government Licence
The Open Government Licence (OGL) covers a large proportion of UK public spatial data, but several important nuances apply in planning practice.
OS MasterMap and premium OS products are not OGL. They are supplied under OS’s own commercial licence agreements, which restrict redistribution, sub-licensing, and use in publicly accessible web maps. If you publish a planning application document that includes OS MasterMap tiles, you need a licence that covers that use — typically through a local authority’s existing OS agreement or a direct commercial licence.
Derived data restrictions. Creating a new dataset by processing or combining OGL data is generally permitted, but the OGL requires attribution of the source. Derived datasets that incorporate OS-licensed data may carry additional restrictions depending on the licence tier. Always check whether your intended output (a published report, a web map, a shared GIS file) constitutes a “derived work” under the licence terms.
OpenStreetMap’s ODbL requires that any database derived from OSM data is also published under ODbL. This share-alike clause has practical implications: a planning model that incorporates OSM street data as a layer in a commercially distributed product may need legal review.
Environment Agency and other government datasets are predominantly OGL, but some specialist products (certain LiDAR collections, survey data) carry additional conditions or require registration. Check the dataset’s individual licence page rather than assuming OGL applies.
Academic data (EDINA Digimap) is licensed for educational and research use only. Using Digimap-sourced data in a commercial planning submission is a licence breach. Practitioners working in both academic and commercial contexts need separate data sources for each.
When in doubt, contact the data custodian directly. Most UK public data bodies have a licensing team and will clarify permitted uses in writing.
Why the data model decision matters more than the tool
The most consequential choice in any spatial dataset workflow is not which GIS software you use. It is whether you have selected the right data model for the phenomenon you are analysing, and whether you have verified the CRS and metadata before building anything on top of it.
Practitioners who treat spatial data as a file-format problem — “I just need to convert this Shapefile to GeoJSON” — routinely discover mid-project that their elevation data is in WGS84 ellipsoidal heights rather than Ordnance Datum Newlyn, or that their building footprints are 18 months stale on a site with recent demolitions. Neither problem is visible until the model produces results that do not match reality.
The vector-versus-raster decision deserves the same deliberate attention. A flood-risk analysis built on a 25 m DEM when a 1 m Environment Agency LiDAR product is freely available is not a resource constraint — it is an oversight. The data exists; the question is whether the practitioner knew to look for it and understood why resolution matters for that specific task.
There is also a tendency in early-stage planning to treat OpenStreetMap as a neutral, cost-free baseline for everything. It is excellent for street networks and points of interest in preliminary sketches. It is not a substitute for OS MasterMap in a planning application, and its ODbL licence has implications that are easy to overlook when a project moves from internal analysis to a published deliverable.
The practical habit that separates reliable spatial analysis from unreliable analysis is simple: keep a data register for every project. Record the source, download date, CRS, licence, and accuracy statement for each dataset before you run a single query. That register takes ten minutes to set up and saves hours of debugging when a client or planning authority questions your methodology.
Best practice reminders for planning teams:
- Check metadata before loading any dataset into a model.
- Prefer authoritative sources (OS, Environment Agency, ONS) for regulatory and client-facing work.
- Always verify and reproject to a unified CRS before combining layers.
- Document data provenance for every dataset used in a stakeholder report or planning submission.
- Keep a project data register updated throughout the project lifecycle.
3D Cityplanner puts your spatial datasets to work immediately
Preparing spatial datasets is only half the task. Translating them into planning decisions requires a platform that can hold vector parcels, raster elevation models, and LiDAR point clouds in the same environment and run scenario comparisons without a lengthy setup process.
3D Cityplanner is a browser-based digital twin platform for urban planning that ingests GIS layers, 3D city models, and point clouds directly, then lets planning teams design, analyse, and compare development scenarios in 3D. Building massing, sunlight and shadow analysis, visibility studies, parking capacity, and development KPIs all update as you adjust the model. There is no local software to install, which means the same model is accessible to planners, developers, and stakeholders in the same browser session. Start a free trial or request a demo to see how your prepared datasets translate into a working 3D planning environment.
Sources
Metadata and accuracy statements are published alongside each dataset on these portals. If a dataset’s accuracy statement is absent or unclear, contact the data custodian before using the data in a regulatory submission. For licence queries on OS products, the OS licensing team responds to written enquiries and can confirm permitted uses in writing.
FAQ
What is a spatial dataset?
A spatial dataset is a collection of data records where each record is linked to a physical location on Earth via coordinates, enabling geographic analysis. Ordnance Survey describes them as data that associates variables or features with a specific geographic position, stored using coordinate systems such as latitude/longitude or the British National Grid.
What is an example of spatial data?
A polygon layer of land parcels with planning-zone attributes is a typical spatial data example; so is a raster digital elevation model, a point layer of tree locations, or a line dataset of road centrelines. Each combines geometry (location and shape) with attributes (descriptive information about the feature).
What is a spatial data structure?
A spatial data structure is the underlying model used to store and organise geographic information — most commonly vector (explicit coordinate pairs for points, lines, and polygons) or raster (a grid of equally sized cells each holding a value). Vector stores geometry explicitly alongside attribute tables; raster encodes continuous phenomena such as elevation or imagery as gridded values.
What is the difference between GIS and spatial data?
Spatial data is the raw geographic information — the coordinates, geometries, and attributes. GIS (Geographic Information System) is the software and analytical framework used to store, process, and query that data. GIS reveals spatial context, patterns, and relationships that support decision-making; without spatial datasets to work with, a GIS has nothing to analyse.
Which coordinate system should UK planners use?
British National Grid (EPSG:27700) is the standard for UK planning work because it uses metric coordinates (Eastings and Northings), making area and distance calculations accurate across Great Britain. WGS84 (EPSG:4326) is appropriate for GPS data and web mapping inputs but should be reprojected to EPSG:27700 before running any site-level spatial analysis or building a 3D city model.