Urban Planning Data Sources: Powering 3D Modelling

Every European city planner or architect working with 3D technology knows the challenge of connecting real data with digital models. Without accurate sources, even the best designs risk missing key details that guide sustainable decisions. Choosing the right urban planning data—whether from sensors, statistical surveys, or social network activity—forms the backbone of effective city modelling. This guide highlights the origins, quality, and best uses of urban data so your 3D models deliver insights every stakeholder can trust.
Table of Contents
- Defining Urban Planning Data Sources
- Categories and Origins of Urban Data
- Integrating 3D Technologies With Data
- Legal Compliance and Data Governance
- Pitfalls and Best Practices in Data Use
Key Takeaways
| Point | Details |
|---|---|
| Understanding Data Sources | Urban planning relies on diverse data sources, which include sensor data, statistical surveys, and crowdsourced information, crucial for accurate 3D modelling. |
| Importance of Data Classification | Classifying data based on its origination—sensor-based or statistical—helps select the right sources for specific planning challenges. |
| Governance and Compliance | Establishing robust data governance frameworks is essential for compliance with regulations like GDPR and ensuring the responsible use of urban data. |
| Addressing Data Quality | Mitigate risks by validating data from multiple sources, as poor-quality data can lead to inaccurate 3D models and flawed urban insights. |
Defining Urban Planning Data Sources
Urban planning data sources form the foundation of every 3D city model you build. Without understanding what these sources are and where they come from, you’re essentially flying blind when designing interventions for European cities.
At their core, urban planning data sources are information streams that capture real-world conditions, patterns, and characteristics of urban environments. These encompass everything from building geometries and infrastructure networks to demographic statistics and environmental measurements. The challenge isn’t finding data—it’s knowing which sources answer your specific planning questions.
Classification by Origin
Data sources fall into two fundamental categories based on how they’re collected. Urban data typically derives from sensors and statistical surveys, alongside social network information. Understanding this distinction shapes how you select and validate data for your 3D models.
Sensor-based sources capture real-time or near-real-time information:
- GPS and mobile phone tracking data
- Air quality and environmental sensors
- Traffic flow detection systems
- Building energy consumption monitors
- Weather stations and climate sensors
Statistical surveys and administrative records provide structured, verified information:
- Census and demographic databases
- Building registries and land cadastres
- Property ownership and use classifications
- Infrastructure asset inventories
- Municipal service records
Social media data and citizen reports add qualitative layers that sensor data alone cannot capture, particularly regarding public perception and lived experience of urban spaces.
Why Classification Matters for 3D Modelling
Different planning challenges demand different data sources. If you’re modelling acoustic impacts from a new transport corridor, you need precise traffic volume data and building façade information. If you’re assessing flood resilience, hydrological measurements and elevation models become critical.
The data you select fundamentally determines what your 3D model can and cannot reveal about urban systems.
European planners increasingly rely on GIS data integration to harmonise multiple sources. This means understanding whether your data is georeferenced, what coordinate system it uses, and how reliably it aligns with other datasets.
Opportunistic vs Non-Opportunistic Collection
Data collection methods split into two approaches. Non-opportunistic sources follow planned methodologies—census surveys, systematic building surveys, scheduled environmental monitoring. These offer consistency but may lag behind current conditions.
Opportunistic sources capture incidental data—mobile phone movements, social media mentions, volunteer observations. These reflect current reality but require careful interpretation and validation.
Both approaches serve 3D planning models. Non-opportunistic data validates your baseline model structure. Opportunistic data reveals how people actually use spaces, revealing gaps between planned and real urban behaviour.
Pro tip: Start by mapping which planning questions your team needs answered, then work backwards to identify which data sources—sensor-based or statistical—actually address those questions rather than collecting data comprehensively.
Categories and Origins of Urban Data
Urban data comes from remarkably diverse sources, and understanding this diversity is critical for building accurate 3D models. You cannot treat all data equally—a mobile phone signal is fundamentally different from a census record, yet both inform urban planning.
Primary Data Categories
Urban planners classify data into sensors and statistical surveys, with social network data forming a distinct subset. Each category behaves differently and requires different validation approaches for your 3D modelling work.
Sensor-generated data streams in continuously:
- GPS trajectories and positioning systems
- Environmental monitoring (air quality, temperature, humidity)
- Building performance sensors (energy, occupancy)
- Traffic detection and movement tracking
- Acoustic and vibration measurements
Statistical surveys provide structured snapshots:
- National census and demographic records
- Building cadastres and property registers
- Infrastructure asset inventories
- Planned sampling surveys and audits
Social network and crowdsourced data capture lived experience:
- OpenStreetMap contributions
- Social media activity and sentiment
- Citizen reports and observations
- Community engagement platforms
The Opportunistic vs Planned Divide
Data collection methods fundamentally split into two approaches. Non-opportunistic collection follows predetermined methodologies—scheduled surveys, systematic building registrations, planned monitoring programmes. These ensure consistency and standardisation but may lag months or years behind current conditions.
Opportunistic collection captures data incidentally—phone movements when people carry devices, sensor readings wherever sensors exist, social media mentions whenever they occur. These reflect current reality with minimal delay but introduce bias based on device distribution and user behaviour.
The distinction between opportunistic and non-opportunistic data shapes how you interpret results and validate your 3D models.
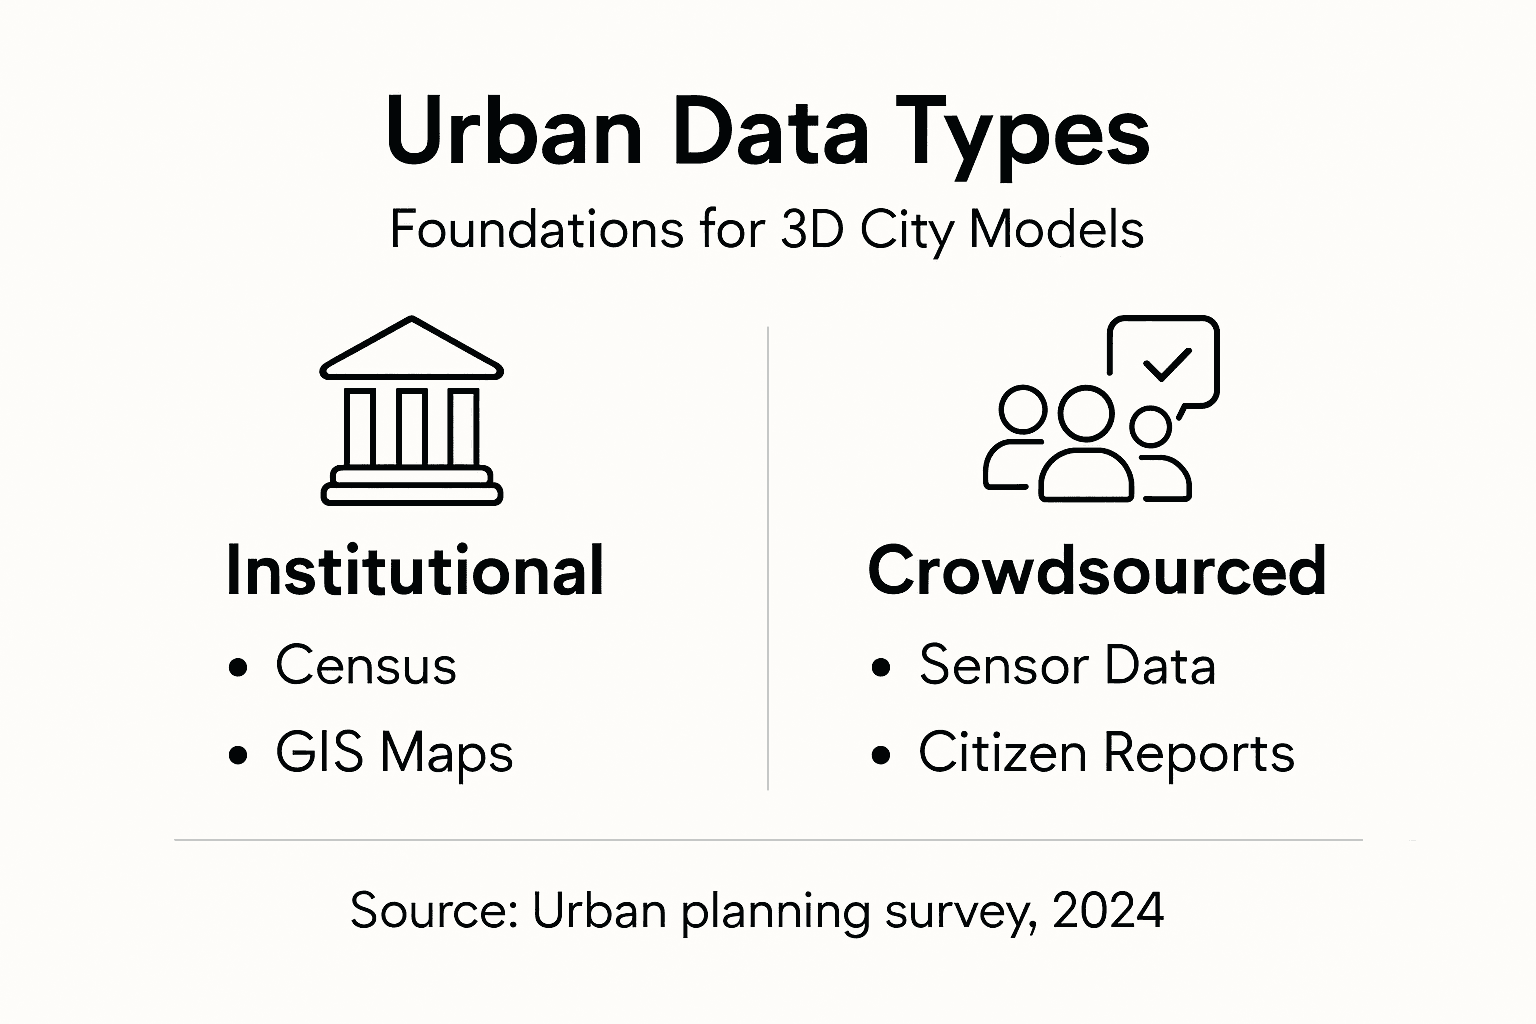
Origins Span Institutional to Crowdsourced
Data origins range from traditional government institutions to decentralised volunteer platforms. Municipal authorities maintain building registries and infrastructure records. National governments conduct census surveys. Private companies operate sensor networks. Communities contribute through platforms like OpenStreetMap, which now powers map data across countless planning applications.

This diversity means your 3D model reflects inputs from government agencies, private technology firms, academic researchers, and volunteers. Each brings different quality standards, update frequencies, and coverage patterns.
Matching your chosen data sources to specific planning challenges is essential. Flood modelling demands elevation data and hydrological measurements. Acoustic analysis requires traffic counts and building façade details. Social equity assessment needs demographic and accessibility data.
Pro tip: Before selecting data sources, list your specific planning questions first—then identify which data categories (sensor, survey, or crowdsourced) actually address those questions rather than collecting everything available.
To clarify how different urban planning data origin categories serve modelling goals, see this summary table:
| Data Origin Type | Typical Examples | Key Urban Modelling Use | Reliability & Update Speed |
|---|---|---|---|
| Sensor-Based | Traffic monitors, weather stations | Real-time visualisation, scenario simulation | High reliability, fast updates |
| Statistical Surveys | Census, property registries | Population analysis, asset mapping | Verified accuracy, slow updates |
| Crowdsourced/Social | OpenStreetMap, citizen reports | Community perception, gap identification | Variable quality, real-time input |
Integrating 3D Technologies With Data
Data alone tells an incomplete story. A spreadsheet of building heights means little until you visualise it spatially. This is where 3D technologies transform raw data into actionable urban insights.
The Synergy Between 3D Modelling and Data Analysis
3D modelling and geospatial technologies enhance city planning through improved visualisation and analysis. When you layer diverse data sources onto 3D city models, patterns emerge that remain invisible in traditional 2D maps or tabular reports.
Your 3D model becomes a dynamic canvas. Traffic sensor data shows movement patterns in real time. Building performance data reveals energy hotspots. Demographic information highlights underserved areas. Each dataset gains spatial context and temporal dimension when integrated into 3D space.
This integration addresses a fundamental planning challenge: stakeholders think spatially. Architects, councillors, and residents visualise change through 3D representation far more effectively than through charts or statistics.
GIS as the Integration Hub
Geographic Information Systems coupled with 3D visualisation supports land use management and infrastructure development. GIS platforms serve as the central nervous system connecting diverse data sources to 3D models.
Within GIS, you can:
- Align multiple coordinate systems and data projections
- Filter and process raw data before 3D visualisation
- Analyse spatial relationships and patterns
- Generate automated 3D geometries from structured datasets
- Track data lineage and quality metadata
GIS transforms messy, heterogeneous data into clean, spatially-referenced layers ready for 3D integration.
Converting Data Into 3D Intelligence
Different data types translate into different 3D representations. Census data becomes demographic heat maps overlaid on building footprints. Traffic counts convert to movement vectors showing flow intensity. Air quality sensors become colour-coded spheres or continuous gradient surfaces.
3D visualisation converts abstract numbers into spatial narratives that stakeholders instinctively understand.
This conversion process requires planning. You must decide which data to visualise, at what level of detail, and through which visual encoding. Too much information overwhelms decision-makers. Too little misses critical insights.
European planners increasingly use 3D models to simulate proposed changes and predict outcomes using integrated data. A new transit route can be modelled with current traffic patterns, demographic distribution, and noise propagation simultaneously.
Real-Time Data Integration Challenges
Static 3D models become outdated quickly. Cities change daily. Sensor networks generate continuous streams of new information. Integrating real-time data requires robust technical infrastructure and clear protocols for updating 3D models.
Some data updates rapidly (traffic, weather, air quality), whilst others change slowly (building cadastres, demographics). Your integration strategy must account for these different update frequencies.
Pro tip: Start with one well-validated data source and one clear planning question—build your 3D integration around answering that question before expanding to multiple sources and complex analyses.
Legal Compliance and Data Governance
Data governance is not optional—it is foundational. Without clear governance frameworks, your urban planning data becomes a liability rather than an asset. European cities operate under strict regulations that demand careful attention to how data is collected, stored, and used.
Understanding Your Regulatory Landscape
Legal compliance and privacy protection are critical priorities in urban data governance frameworks. In Europe, you navigate multiple overlapping regulations that affect every stage of your data work.
The General Data Protection Regulation (GDPR) constrains how you handle personal information—including location data, demographic records, and even anonymised datasets that could potentially identify individuals. Beyond GDPR, sector-specific regulations govern building information, environmental data, and infrastructure records.
Your 3D city models may incorporate data from dozens of sources, each with distinct legal constraints. Census data comes with strict access limitations. Traffic sensor data collected through public infrastructure may have different restrictions. OpenStreetMap contributions operate under Creative Commons licences.
Building Governance Frameworks
Effective governance starts with transparent policies about data collection, access, and usage. Your framework should address:
- Data ownership and liability responsibilities
- Access controls and user permissions
- Data retention and deletion schedules
- Quality standards and validation procedures
- Incident response and breach notification protocols
- Interoperability agreements with partner organisations
Municipal governments must document these policies clearly. Ambiguity creates risk—both legal and operational. A council that cannot explain how it obtained building data or justify why it retains specific information faces regulatory scrutiny.
Privacy by Design in Urban Data
Data governance practices should ensure transparency, accountability, and compliance with data protection regulations. This means building privacy protections into your 3D models from the outset, not as an afterthought.
Privacy and utility are not opposing forces—good governance balances both through deliberate design choices.
When integrating sensor data or social information, anonymise at the earliest possible stage. Aggregate traffic flows rather than tracking individual vehicles. Show demographic patterns without revealing household details. Use differential privacy techniques if publishing datasets publicly.
Your stakeholders—residents, businesses, community groups—must understand what data you hold and how you use it. Transparency builds trust. Secrecy breeds suspicion and legal vulnerability.
Documentation as Protection
Document everything. Data lineage, processing steps, quality assessments, access logs—these records protect you. If a data accuracy question arises, documentation proves your diligence. If a privacy concern emerges, your records demonstrate compliance efforts.
Create data inventories listing each source, its legal basis, access restrictions, update frequency, and quality metrics. Review these inventories regularly. Outdated datasets should be removed or refreshed systematically.
Pro tip: Appoint a dedicated data governance lead within your planning team—someone responsible for regulatory compliance, documentation, and policy updates—rather than distributing these responsibilities across multiple roles.
Pitfalls and Best Practices in Data Use
Data is powerful. Data is also dangerous. Many urban planning projects fail not because data doesn’t exist, but because planners misuse it. Understanding common pitfalls helps you avoid costly mistakes.
The Quality Problem
Data quality issues, inaccuracies, and biases are common pitfalls in urban data usage. You might inherit datasets where collection methods changed mid-project, or where sensor calibration drifted over time. Census data becomes outdated within months. OpenStreetMap entries reflect volunteer effort rather than municipal verification.
Bad data silently corrupts your 3D models. If building height data is systematically underestimated by 2 metres across an entire district, your energy models become unreliable. If traffic counts miss peak hours, your transport analysis fails to address actual congestion.
Validation is not optional. Test data against ground truth. Cross-check multiple sources. Document discrepancies explicitly.
Single-Source Dependency
You cannot build robust planning models on one data source. Overreliance on a single dataset and lack of interoperability are typical pitfalls affecting urban models.
Consider traffic modelling. A single sensor network shows flows at monitored locations only. Add demographic data and you understand who travels. Add air quality data and you model pollution exposure. Remove the demographic layer and your model becomes incomplete.
Risk mitigation requires diversity:
- Cross-validate findings across multiple data sources
- Identify gaps where no data exists
- Use complementary datasets that reveal different aspects
- Build redundancy so single-source failures don’t derail projects
Diversity strengthens models. Convergence across independent sources builds confidence.
Bias and Representation
Not all data represents all people equally. Traffic sensors miss pedestrians. Building registries omit informal structures. Social media reflects younger, more affluent demographics.
Unexamined data bias invisibly skews planning decisions away from marginalised communities.
Addressing bias requires conscious effort. Conduct participatory planning involving those whose voices are missing from datasets. Supplement quantitative data with qualitative research. Disaggregate results by neighbourhood and demographic group to reveal disparities.
Your 3D models should represent reality honestly, including the spatial inequalities that data alone might obscure.
For an at-a-glance guide to common data pitfalls and mitigation strategies in urban modelling projects:
| Pitfall | Impact on 3D Planning | Mitigation Strategy |
|---|---|---|
| Data Quality Issues | Inaccurate model predictions | Cross-validation, regular ground surveys |
| Single-Source Dependence | Incomplete urban insights | Integrate multiple independent datasets |
| Data Bias | Misrepresentation of groups | Combine quantitative with qualitative data |
Best Practices for Reliable Use
Implement structured approaches to strengthen your data work:
- Document data lineage—track where each dataset originated and how it was processed
- Establish validation protocols—test accuracy against ground truth before integration
- Create transparency about limitations—explicitly state what data covers and what it misses
- Foster collaboration—involve domain experts, community members, and technical specialists
- Enable reproducibility—ensure others can verify your analysis methods
These practices take time initially but save months of rework later. They also build stakeholder confidence. Residents and officials trust planning based on transparent, documented data more than opaque modelling.
Pro tip: Begin every urban planning project by mapping which planning questions require answers, then identify data gaps honestly—acknowledge what you cannot answer rather than using poor proxies that appear to address your questions but mislead instead.
Unlock the Full Potential of Your Urban Planning Data with Advanced 3D Modelling
Urban planning demands precise integration of diverse data sources—from sensor streams to statistical surveys—to create reliable and insightful 3D city models. If you struggle with data quality challenges or the complexity of combining real-time sensor inputs with cadastral and demographic databases, you are not alone. Accurate visualisation, seamless data integration, and dynamic 3D analysis are essential to overcome these hurdles and translate complex datasets into actionable urban insights.
Discover how 3dcityplanner.com empowers you to harness your urban data efficiently. Our platform offers automatic building generation, realistic noise simulation, and time-aware 4D planning tools that bring sensor data, census records, and crowdsourced inputs to life within a unified 3D environment. By centralising your workflows on 3dcityplanner.com, you can reduce data silos, improve validation processes, and create compelling spatial narratives tailored to your planning questions. Act now to elevate your modelling accuracy and optimise stakeholder collaboration by exploring our easy trial and training resources designed to get you started quickly. Access the advanced solutions you need today at 3dcityplanner.com.
Frequently Asked Questions
What are urban planning data sources?
Urban planning data sources are information streams that capture the real-world conditions, patterns, and characteristics of urban environments, including building geometries, infrastructure networks, demographic statistics, and environmental measurements.
Why is it important to classify urban data sources?
Classifying urban data sources as sensor-based or statistical helps urban planners select and validate data appropriate for specific planning questions, ensuring that the 3D models built reflect accurate and relevant information.
What is the difference between opportunistic and non-opportunistic data collection?
Non-opportunistic data collection follows planned methodologies and provides structured, verified information, while opportunistic data collection captures incidental data in real-time but requires careful interpretation and validation as it may reflect biases based on user behaviour.
How do 3D modelling and data analysis enhance urban planning?
3D modelling and data analysis enhance urban planning by improving visualisation and analysis, allowing planners and stakeholders to identify patterns and insights that are not visible in 2D maps or tabular reports, thereby supporting effective decision-making.