City Skyline Analysis for Planners: NEN‑EN 17037 and a Digital Twin

Skyline analysis measures how a proposed building or masterplan changes what an observer sees against the sky from a fixed point, using metrics such as vertical viewing angle and percent sky visible. Planners run it whenever a high-rise proposal, view corridor, or heritage setting is at stake, comparing baseline and post-development conditions. The method draws on standards like NEN‑EN 17037 and tools ranging from ArcGIS to browser-based digital twins such as 3D Cityplanner.
TL;DR:Skyline analysis primarily measures the vertical shape of views from fixed points, helping assess the impact of proposed high-rises on specific vistas.It requires minimal data: observer locations, 3D building models, terrain, and land cover layers are sufficient for reliable results.Vector skyline tools offer precise, point-by-point comparisons, while digital twins enable quick scenario testing and easy iteration.Standardized metrics like percentage sky loss and vertical angle changes guide mitigation efforts early in design, before schemes reach committee.Presenting paired visuals with clear metrics and sensitivity tests improves decision-making and trust among stakeholders.
3D CityplannerTest Skyline Scenarios in 3DCompare spatial development scenarios with 3D city models, visibility analysis and project calculations in one browser-based platform.Explore 3D Cityplanner
Table of Contents
- What is skyline analysis and how does it differ from a viewshed?
- What data and metrics does skyline analysis need?
- Which methods and tools handle skyline work best?
- How do you run a before/after skyline comparison?
- How should results be presented to committees and the public?
- Running skyline scenarios in a digital twin
- Skyline analysis should guide design, not just gatekeep it
- Try skyline analysis in a browser-based digital twin
- Standards and documentation worth citing
- Sources
- FAQ
What is skyline analysis and how does it differ from a viewshed?
A skyline is the outline formed where buildings, terrain and vegetation meet the sky, as seen from one fixed observer point. An eyeline is a single sightline between two points, typically used to check whether a specific object or building is blocked. A viewshed is broader still: it maps every location visible from (or to) an observer across an entire area, often using isovist geometry to describe the visible polygon around a point.
Skyline analysis sits between these. It quantifies the vertical and horizontal shape of what one observer sees along the horizon, rather than mapping visibility across a whole neighbourhood.
NEN‑EN 17037 frames the result in three bands, minimal, good and excellent, based on horizontal viewing angle and the proportion of sky, horizon and ground visible from a defined eye height. That classification gives municipal committees a shared vocabulary instead of subjective impressions.
- Skyline: outline against the sky from one observer point
- Eyeline: a single sightline to a specific target
- Viewshed/isovist: the full visible area or polygon around a point
- NEN‑EN 17037 rating: minimal, good or excellent view quality
Skyline work differs from wider landscape or heritage assessments mainly in scope. Heritage studies often weigh cultural meaning and historic sightlines across a district; skyline analysis stays narrowly quantitative, anchored to specific viewpoints.
What data and metrics does skyline analysis need?
You need surprisingly little to start, but each input shapes the result. The core requirements are:
- Observer point(s) — fixed locations where the analysis is run from, documented precisely, since results shift with even small position changes
- Building geometry — a multipatch or LOD1/LOD2 3D model of existing and proposed structures
- Terrain or a digital surface model — optional, but necessary where topography itself blocks or frames the skyline
- Land use and vegetation layers — useful when mature trees or green corridors materially affect what is visible
Once the geometry is in place, the outputs worth reporting are the horizontal viewing angle, the minimum and maximum vertical angles, the percentage of sky visible, and a skyline exposure percentage summarised in a skyline graph. Observer height typically follows a standing eye height around 1.6 metres, and sample points should represent real vantage locations: rooftops, public promenades, and windows in existing dwellings rather than arbitrary map coordinates.
Statistic callout: one documented case using ArcGIS’s skyline tools found that a single proposed building reduced visible sky by roughly 1%, alongside a several-degree increase in maximum vertical angle from the tested viewpoint.
Which methods and tools handle skyline work best?
Raster viewshed and isovist methods answer “what can be seen from everywhere,” which suits area-wide visibility studies, privacy checks, or identifying blind spots across a site. Vector skyline methods answer a narrower question: “what does this exact outline look like from this exact point,” which is what committees actually need when weighing a specific tower against a specific view.
ArcGIS 3D Analyst’s Skyline, Skyline Barrier and Skyline Graph tools cover most of this ground. Skyline generates the outline itself as a 3D polyline; Skyline Barrier renders it as a volume useful for massing studies; Skyline Graph converts the geometry into the numeric summaries, percent sky visible, angle ranges, that go into reports. Parameters such as azimuth step size and horizon radius directly affect precision, so document them alongside your results.
- Raster viewshed/isovist: area-wide visibility, blind-spot detection, privacy screening
- Vector skyline: point-specific before/after comparison for a proposal
- Skyline Barrier: volumetric visual for massing discussions
- Skyline Graph: the numeric summary for reports and appendices
3D city models and digital twins add a layer neither raw tool does alone: rapid scenario comparison. Instead of rerunning a static analysis for each design iteration, a platform like 3D Cityplanner lets you swap massing options and regenerate visuals in the same session, which shortens the design-review loop considerably.
Pro Tip: Run a low-detail (LOD1) pass first to catch obvious conflicts before investing time in high-fidelity geometry. A blocky mass model resolves most “will this even work” questions faster than a fully textured one.
How do you run a before/after skyline comparison?
A defensible comparison follows a fixed sequence, not an improvised one. Skipping steps is usually what gets a report challenged at committee.
- Define objectives and constraints. Identify the legal or policy driver, protected view corridor, heritage setting, high-rise policy zone, and select observer locations that represent genuine public or affected vantage points by consulting resources like Urbex’s developer approvals and permits to understand the planning context.
- Assemble and validate data. Pull current building shells, terrain where relevant, and an up-to-date cadastre. Mismatched or outdated cadastral data is the most common source of disputed results.
- Run the baseline. Generate the existing skyline and viewshed outputs and produce the skyline graph for each observer point before touching the proposal.
- Insert the proposed massing and rerun. Compute the deltas directly: change in maximum vertical angle, percentage of sky lost, and any new barrier volume. Produce annotated before/after visuals at this stage, not later.
- Write the executive summary. Lead with two or three decision metrics, not a data dump, and append the full technical outputs for anyone who wants to verify them.
This sequence matters because committees and objectors alike will ask “what changed and by how much,” and a workflow that answers that in one pass, using consistent observer points throughout, saves you from rerunning the whole analysis under scrutiny.
How should results be presented to committees and the public?
Numbers alone rarely move a planning decision; the visual has to carry the argument. Paired panoramas (before and after, same camera position) remain the most persuasive format for lay audiences, while polar skyline graphs and barrier volumes give technical reviewers something to check against the raw geometry.
Decision-makers tend to gravitate to two or three figures: percentage change in visible sky, and the increase in maximum vertical angle. Present both prominently rather than burying them in an appendix table.
- Paired panoramas for the same camera position, before and after
- Polar skyline graphs for technical reviewers
- Barrier volumes to communicate massing impact in 3D
- Plain-language captions explaining what a given angle or percentage change means in practice
Heritage and privacy objections respond better to sensitivity tests, showing how the result shifts with small changes in massing or observer position, than to a single fixed number. A structured approach to visibility that separates genuine exposure risk from perceived risk tends to reduce the emotional charge of these debates. Structure the final report as executive summary, then metrics, then visuals, then technical appendix, in that order, so busy reviewers get the answer before the evidence.
Running skyline scenarios in a digital twin
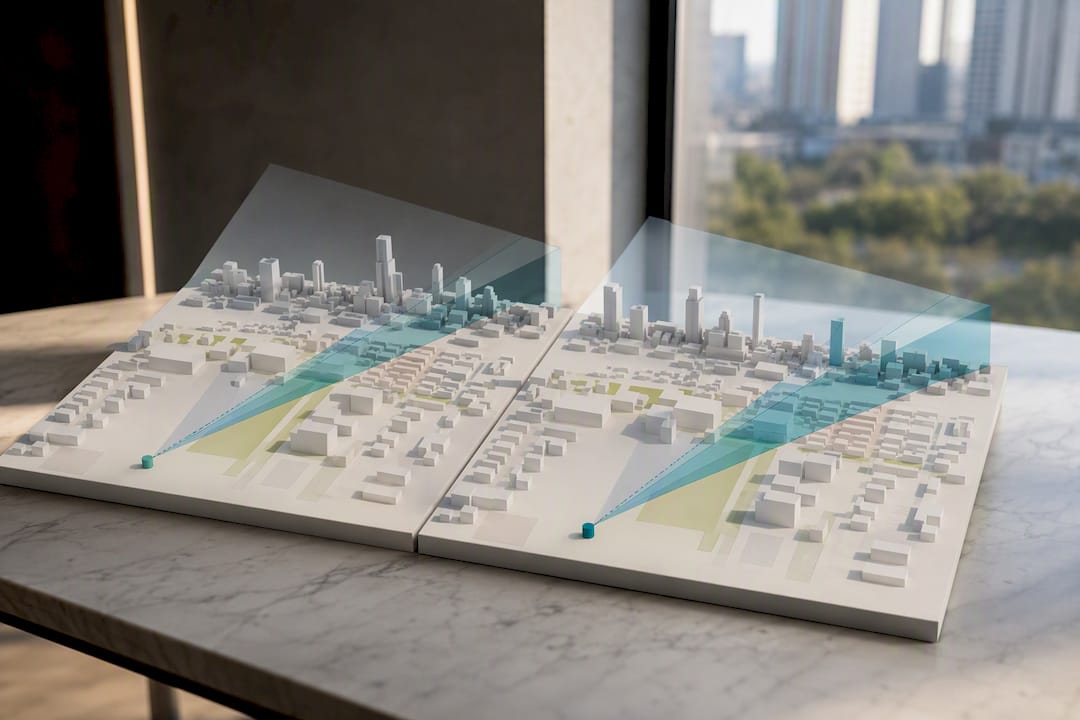
A typical workflow inside a browser-based digital twin starts with a GIS import: cadastral parcels, existing building footprints, and terrain where available. From there, you build a 3D city model of the study area, place observer points at the vantage locations identified in your brief, and generate skyline and visibility layers directly against the existing situation.
The value shows once you add a proposed scenario. Comparing the baseline against one or more massing options in the same session, rather than as separate exports, keeps observer points and parameters consistent between runs, which is exactly what a defensible before/after comparison requires. Outputs map directly onto the decision metrics committees ask for: percent sky visible, skyline graph summaries, and annotated panoramas ready for a report appendix.
- GIS import of parcels, footprints and terrain
- 3D city model generation from that base data
- Observer point placement matching the analysis brief
- Scenario comparison with exportable visuals for reporting
Platforms built for this, such as 3D Cityplanner’s 3D city modelling tool, are designed so planning teams can iterate on massing without waiting on a GIS specialist for every version.
Skyline analysis should guide design, not just gatekeep it
Skyline evidence works best as a design input early, not a veto delivered late. A one percent change in sky visibility from a harbour promenade might be decisive; the same change from a side street rarely is, and treating every delta as equally serious erodes trust in the method. Use the metrics to trigger mitigation, screening, stepped massing, revised orientation, well before a scheme reaches committee, and keep the underlying figures open to scrutiny throughout. Densification and view protection are not opposites; they are constraints to negotiate in full view of the numbers.
— Anne Dullemond
Try skyline analysis in a browser-based digital twin
Running the workflow above in desktop GIS works, but it usually means separate exports every time a massing option changes, which slows the design-review loop right when momentum matters most. Such platforms keep observer points, building geometry and scenario comparisons in one browser session, so a planning team can test multiple massing options against the same baseline skyline in a short time rather than enduring lengthy file handoffs.
That matters most in early feasibility work, where a municipality or developer needs a defensible before/after visual before a scheme is fixed enough to justify a full GIS build. For heavier data processing, custom raster analysis, or integration with existing enterprise GIS pipelines, desktop tools still have their place, but for scenario testing and stakeholder-facing visuals, a browser-based digital twin for cities is generally the faster route to a decision-ready report. If your team is weighing a high-rise proposal or a view-corridor policy this quarter, request a demo and run your own site through it before the next committee cycle.
Standards and documentation worth citing
Cite NEN‑EN 17037 for view-quality classification and the ArcGIS Pro Skyline documentation for tool parameters. Include raw skyline graph outputs and observer coordinates as a technical appendix, not just summary figures, so any reviewer can reproduce the result.
Sources
- NEN‑EN 17037 (view quality standard)
- Skyline analysis: An urban environment design aid — ArcMap documentation
- How Skyline works — ArcGIS Pro documentation
FAQ
What is the skyline of a city?
A city’s skyline is the outline its buildings, terrain and structures form against the sky when viewed from a specific point. In planning terms, that outline becomes measurable through vertical and horizontal viewing angles and the percentage of visible sky.
What are the four defining characteristics of a city, in skyline terms?
While definitions vary by discipline, skyline analysis typically treats building height and massing, land use pattern, terrain, and vegetation cover as the four elements that shape a city’s visual outline against the sky.
What does “skyline” actually mean?
The term describes the visible line where a city’s built or natural features meet the sky from a given viewpoint. Planners formalise that everyday meaning into angles and percentages using tools like ArcGIS’s skyline outputs so the impression becomes a comparable metric.
How does skyline analysis differ from a viewshed study?
Skyline analysis quantifies the outline seen from one fixed point, while a viewshed maps every visible location across an entire area. Both can use similar 3D building and terrain data, but they answer different planning questions.
Which standard governs view quality assessments?
NEN‑EN 17037 classifies view quality into minimal, good and excellent bands based on horizontal viewing angle and the visible proportions of sky, horizon and ground.