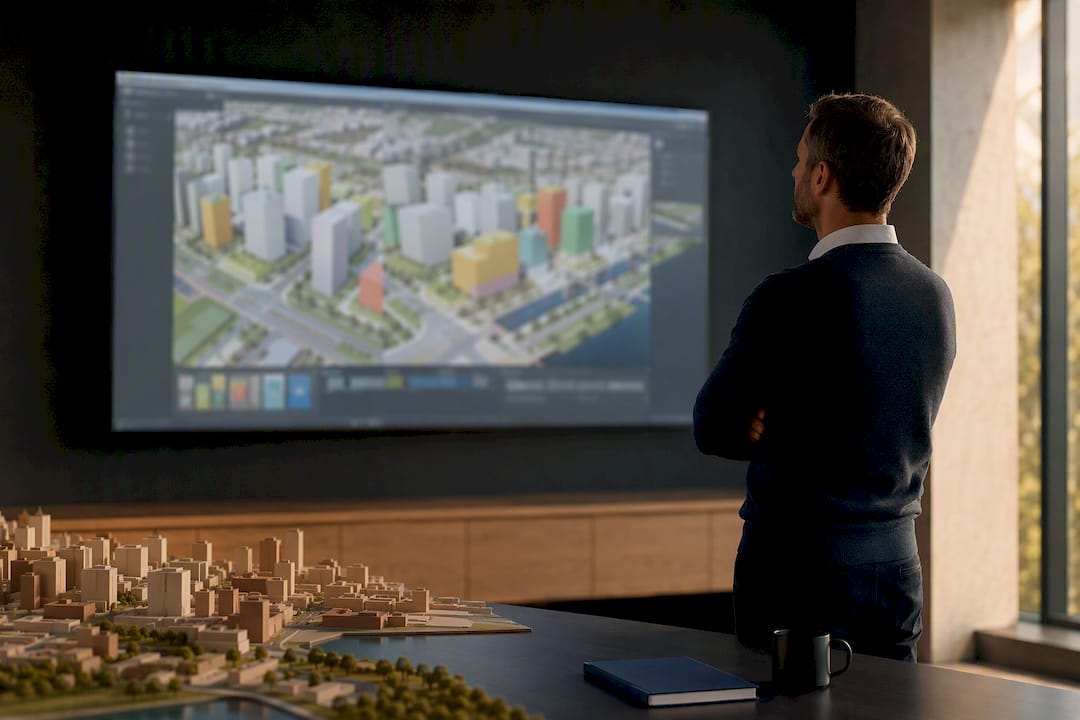
Five Steps to a Publishable 3D Omgevingsplan for Dutch Municipalities

Yes, implement a browser-based 3D Digital Twin as an interactive layer linked to DSO/LVBB and PDOK data. This turns your omgevingsplan into something residents understand and legal teams can test properly. The essential systems are the Digitaal Stelsel Omgevingswet (DSO), the LVBB publication facility, STOP/TPOD standards, PDOK’s 3D-Basisvoorziening, BAG/BGT geometry, and AHN height data. Done correctly, this combination speeds up decisions, strengthens toetsbaarheid, and cuts down on objections that stem from misreading a flat map.
TL;DR:Most Dutch municipalities can access usable 3D models from the nationwide 3D-Basisvoorziening data, which covers LoD 1.3 and LoD 2.2 models without needing bespoke surveys.Browser-based platforms like 3D Cityplanner simplify scenario testing and stakeholder participation, reducing objections and the need for late-stage corrections.Building a 3D omgevingsplan involves five key steps, with testing and validation before publication being crucial to avoid delays or rejections.Early interoperability decisions, such as appropriate LoD levels and modular design, save time and facilitate reuse of models for future plans.The legal omgevingsplan remains the official document; the 3D model serves as an interactive, spatial illustration aligning with plan rules but does not replace formal publication.
3D CityplannerBring 3D Insight to Urban Plans3D Cityplanner helps municipalities and planning teams analyse scenarios, compare development options, and communicate spatial plans in the browser.Explore 3D Cityplanner
Table of Contents
- What does a 3D omgevingsplan actually look like?
- Why is 2D no longer enough for spatial planning?
- What benefits and use cases justify the effort?
- How do you actually build one, step by step?
- What best practices prevent costly rework?
- How does a platform like 3D Cityplanner fit this workflow?
- Author’s perspective on where Dutch digital twins are heading
- Get your first 3D omgevingsplan project moving
- Sources
- FAQ
What does a 3D omgevingsplan actually look like?
A 3D omgevingsplan is not a replacement for the legal document. It is a Digital Twin layer, a browser-based 3D model that sits alongside the textual and 2D omgevingsplan and translates its rules into something you can walk through and measure. The formal legal instrument stays the STOP/TPOD-compliant document published through the DSO. The 3D layer illustrates what that document permits, in space.
In practice, municipalities use this layer to produce:
- Building massing studies showing maximum envelopes under current zoning rules
- Sun and shadow analyses for neighbouring plots and public space
- Visibility and sightline checks from streets, gardens, or heritage viewpoints
- Drainage and water storage overlays tied to ground height data
- Land-use overlays comparing current use against proposed development capacity
None of this replaces the legal text. It makes the legal text checkable before anyone signs off on it.
Why is 2D no longer enough for spatial planning?
Two-dimensional plans hide the three things that generate the most objections and appeals: height, sightlines, and multi-level infrastructure clashes. A parcel boundary on a flat map tells you nothing about whether a five-storey block will shade a neighbour’s garden at 4pm in October, or whether a proposed pedestrian route crosses beneath a utility corridor that was never mapped in plan view.
- Height and massing are invisible in 2D. A building envelope drawn as a footprint says nothing about bulk, so residents routinely underestimate what gets built until scaffolding appears.
- Public consultation runs on guesswork. Without a 3D interactive environment, residents interpret technical drawings inconsistently, which generates confused feedback and repeat consultation rounds.
- Conflicts surface too late. Underground infrastructure, drainage routes, and sightline obstructions often only become apparent during construction, once a 3D spatial planning check would have caught them at the design stage.
The result of skipping 3D is not just slower meetings. It is weaker toetsbaarheid, the legal testability of a plan, because reviewers and courts increasingly expect evidence that spatial effects were actually assessed, not assumed.
What benefits and use cases justify the effort?
The return on a 3D omgevingsplan shows up fastest in three places: participation, scenario testing, and administrative robustness.

For participation, a browser-based 3D participation process lets residents rotate a proposed development, check shadow impact on their own garden, and give feedback grounded in what will actually be built, rather than a misread floor plan.
For scenario testing, planners compare development capacity under different massing options, run sunlight studies against existing and proposed geometry, and model drainage behaviour using AHN-derived terrain. This is also where cross-domain planning pays off: Digital Twins increasingly support integrated questions spanning housing, climate adaptation, and mobility in a single model.
For administrative outcomes, plans backed by 3D evidence tend to draw fewer late-stage objections, because conflicts get caught during design rather than during appeal.
Pro Tip: Run your sunlight and visibility analyses before public consultation opens, not after. Catching a shadow conflict during scenario testing costs an afternoon; catching it during an appeal costs months.
How do you actually build one, step by step?
A municipal team can move from scoping to publication in five checkpoints, each with a clear output.
- Scope the project. Define which omgevingsplan or partial revision is in scope, who signs off on spatial data (GIS team, legal, planning department), and which stakeholders need visual input.
- Collect and augment data. Pull PDOK’s BAG, BGT, and AHN layers as your base, then add local aerial imagery, survey points, or cadastral detail where precision matters, such as for a permit-grade sunlight study.
- Build the model and choose LoD. Decide LoD 1.3 or LoD 2.2 per zone based on how the output will be used, and tag geometries to the relevant plan rules so the visual layer stays traceable to the legal text.
- Add analytic modules. Layer in sunlight, visibility, drainage, or capacity calculations depending on what the plan area actually needs tested.
- Validate and publish. Test the STOP/TPOD submission in the LTO or PRE-ETO pre-production environment, confirm it passes the Plan-Plan validation portal, then publish via the LVBB so the rules appear correctly in Regels op de kaart inside the Omgevingsloket.
Skipping step five’s testing stage is the single most common cause of rejected or delayed publications.
What best practices prevent costly rework?
Interoperability decisions made early save far more time than they cost. Choosing LoD 1.3 for a broad heat-stress scan across an entire municipality makes sense; choosing it for a permit-grade shadow study on a contested plot does not, since roof detail changes the outcome. Augment with local high-resolution data whenever a decision hinges on precise geometry rather than general massing.
Design for modularity rather than a single monolithic model:
- Keep the viewer, the analytic modules (sunlight, drainage, capacity), and the underlying data services (PDOK, BAG) as separate components
- Favour open APIs aligned with nLDT and DTaaS principles, so a module can be swapped without rebuilding the whole twin
- Assign clear data stewardship: who owns versioning, who signs off before LVBB submission, and who resolves conflicts between local overlays and national datasets
- Choose a browser-based viewer over desktop GIS wherever the audience includes non-specialists, since installation barriers quietly exclude the residents and councillors you most need engaged
Pro Tip: Treat your 3D layer like infrastructure, not a one-off deliverable. A modular setup lets you reuse the same sunlight module on the next area plan instead of rebuilding it from scratch.
How does a platform like 3D Cityplanner fit this workflow?
A browser-based digital twin platform handles the operational middle of this workflow: pulling in PDOK geometry, generating massing automatically, running sunlight and visibility analyses, and letting planners compare scenarios side by side without desktop GIS installs. That browser delivery matters most for participation checklists under the Omgevingswet, where the goal is getting non-specialists engaged, not just technically compliant.
For municipalities starting out, three project types offer a manageable entry point:
- A gebiedsscan covering an existing neighbourhood, to establish a baseline before any new plan is drafted
- A participatory consultation visual for a single contested site, to test resident reaction before formal procedure
- A permit-ready sunlight study for a plot already in the pipeline, to catch shadow conflicts before objections arrive
| Starter project | Primary output | Typical trigger |
|---|---|---|
| Gebiedsscan | Baseline 3D model of existing area | New plan or revision starting |
| Participatory visual | Interactive scenario for residents | Contested or high-visibility site |
| Sunlight study | Permit-grade shadow analysis | Plot already in permit process |
Author’s perspective on where Dutch digital twins are heading
Too many municipalities still treat 3D visualisation as a one-off rendering job rather than infrastructure. That habit produces disposable models that get rebuilt for every new plan. The smarter path, backed by Geonovum’s push toward modular, interoperable twins, is starting small: pick one neighbourhood, build a PDOK-based proof-of-concept in a browser viewer, and design it to be reused rather than replaced.
— Anne Dullemond
Get your first 3D omgevingsplan project moving
A browser-based digital twin platform enables municipal teams to combine PDOK geometry, automated massing, and scenario comparison without procuring separate desktop GIS licences or bespoke modelling services for every plan.
Where a traditional consultancy engagement means commissioning a bespoke 3D model for each plan revision, this platform lets your own team run the gebiedsscan, sunlight study, or participatory visual directly, without waiting on external modelling turnaround each time. The platform combines nationwide GIS data with local augmentation, spatial and financial scenario analysis, and stakeholder communication tools tailored for early-phase feasibility work, supported by expert Construction SEO Services | Prove It & Win More Bids to help procurement teams. Pricing runs from Starter at €79 per month up to Team and Organisatie tiers for larger departments, with implementation and onboarding support available for procurement teams that need a structured rollout. If you are weighing up a first pilot, start with a gebiedsscan for your priority area or book a demo to see how the workflow maps onto your own omgevingsplan process.
Sources
Every credible 3D omgevingsplan in the Netherlands rests on the same national foundation, and skipping any part of it creates rework later. PDOK’s 3D-Basisvoorziening combines BAG and BGT geometry with AHN-derived heights, giving planners two levels of detail:
- Omgevingsdocumenten publiceren | Ontwikkelaarsportaal
- Van silo-oplossingen naar ecosysteem | Geonovum
Statistic callout: the 3D-Basisvoorziening is built specifically to deliver LoD 1.3 and LoD 2.2 models nationwide, meaning Dutch municipalities generally have a usable 3D starting point without commissioning bespoke surveys.
Publication is a separate matter from visualisation. The DSO requires every omgevingsdocument to follow STOP/TPOD standards, and formal publication happens through the LVBB, the landelijke voorziening bekendmaken en beschikbaar stellen. Before going live, suppliers and municipalities test submissions in pre-production environments, including the LTO and PRE-ETO, and validate structure through the Plan-Plan validation portal. Skipping these test cycles is the most common reason submissions get rejected on first attempt.
FAQ
What is the difference between a 3D omgevingsplan and the legal omgevingsplan?
The legal omgevingsplan is the STOP/TPOD-compliant text and 2D document published through the DSO and LVBB. The 3D omgevingsplan is a visual Digital Twin layer that shows what those rules permit spatially, but it never replaces the formal published document.
Which Dutch dataset should I start with for a 3D model?
Start with PDOK’s 3D-Basisvoorziening, which combines BAG and BGT geometry with AHN heights in LoD 1.3 and LoD 2.2. Add local aerial imagery or survey data only where a specific analysis, such as a permit-grade sunlight study, needs finer precision.
Do I need to publish 3D visualisations through the LVBB?
No. Only the STOP/TPOD-compliant omgevingsdocument itself goes through the LVBB publication process. The 3D layer sits alongside it as a communication and analysis tool, tagged to the same plan rules for traceability.
What does 3D Cityplanner cost for a municipality?
Pricing starts at the Starter tier for €79 per month or €790 per year, with Professional, Team, and Organisation tiers for larger departments, all listed on the pricing page. Implementation and onboarding support is available separately for procurement teams planning a structured rollout.
How long does it take to build a first 3D omgevingsplan pilot?
A scoped pilot, such as a single-area gebiedsscan or one permit-ready sunlight study, typically moves faster than a full plan revision because it uses existing PDOK data rather than commissioning new surveys. Exact timelines depend on how much local data augmentation the specific analysis requires.