Run It With Three Scenarios: MIRT Aligned MKBA for Dutch Area Development

Run a maatschappelijke kosten-batenanalyse (MKBA) when an gebiedsontwikkeling involves public finance, competing policy objectives, or effects that stretch across mobility, housing, and public space at once. The single most important practice rule is this: never present property uplift or livability gains as one confident number. Follow the Werkwijzer MKBA bij MIRT, build a defensible nulalternatief, and show every uncertain effect as a range across scenarios rather than a point estimate.
TL;DR:Property uplift and livability effects should be presented as a range across different scenarios to account for local context and uncertainty.Full MKBAs are most appropriate during the verification and plan development stages, especially for large, publicly funded, or environmentally impactful schemes.Define the project scope early, build a defensible baseline, and compare multiple scenarios to keep assumptions transparent and reviewable.Use spatial data from 3D modelling and GIS to refine impact estimates like sunlight, green space, and development capacity before valuation.Include a clear decision summary in reports with scenario ranges, visualisations, and an assumption log to support council decision-making.
3D CityplannerCompare Urban Scenarios With ConfidenceUse 3D Cityplanner to analyse and compare development scenarios with spatial data for clearer, more transparent area development decisions.Explore 3D Cityplanner
Table of Contents
- When to use an MKBA in gebiedsontwikkeling
- Core MKBA steps for gebiedsontwikkeling: a practical checklist
- Why property uplift and livability need ranges, not point estimates
- Aligning MKBA with MER, broad welvaart, and planning instruments
- How GIS and 3D scenario modelling sharpen MKBA inputs
- How to report MKBA results so councils can decide
- Practitioner perspective: common pitfalls and quick remedies
- Putting the workflow into practice with 3D Cityplanner
- Sources
- FAQ
When to use an MKBA in gebiedsontwikkeling
An MKBA earns its cost when a project sits at a genuine decision gate, not when it is used to justify a plan already agreed politically. The MIRT process gives you four natural checkpoints: verkenning, planuitwerking, realisatie, and the initial voorbereiding phase where scope is still open. Match your appraisal effort to the gate you are actually facing.
- Preparation phase: a light effects scan is usually enough. Save the full MKBA for when alternatives are still genuinely on the table.
- Verkenning: this is where a full MKBA earns its keep, comparing alternatives before commitments harden.
- Planuitwerking: update the MKBA with refined cost estimates and narrower scenario bands as design detail increases.
- Realisatie: only revisit the MKBA if scope or funding changes materially.
Full MKBAs make sense for integrated mixed-use developments combined with public infrastructure, large redevelopment schemes carrying public subsidy, and any project with real distributional or environmental consequences. Smaller redevelopments or single-function schemes with modest public exposure are usually better served by a quick effects matrix or a distributional checklist rather than a full appraisal.
Core MKBA steps for gebiedsontwikkeling: a practical checklist
A gebiedsontwikkeling MKBA follows the same logic as any cost-benefit analysis, but the effects list and the data sources look different from a single infrastructure project. Five steps carry most of the analytical weight.
- Define objectives, stakeholders, and decision criteria. Fix the geographic boundary and the time horizon before anyone starts collecting numbers. A vague scope is the single most common cause of a disputed MKBA later.
- Build the nulalternatief. Document what happens without the project, including demographic trends, market cycles, and any autonomous development that would occur regardless. Treat this baseline as a set of assumptions, not a fact.
- Itemise the effects. Cover accessibility, agglomeration benefits, livability, health, nature, water, climate resilience, direct costs, and distributional effects across income groups or neighbourhoods.
- Value each effect. Use market prices where they exist, shadow prices where they don’t, and standard transfer rules from the Werkwijzer MKBA bij MIRT for effects that resist monetisation. Tag anything you cannot value in euros as an explicit qualitative outcome rather than forcing a number onto it.
- Aggregate and report. Present net present value as a range tied to scenarios, alongside the non-monetary evidence in its own table, with full appendices covering methods, data provenance, and assumptions.
Pro Tip: Treat the nulalternatief as a probabilistic baseline whenever demographic or market trends could swing it. Assign rough likelihoods to two or three plausible baselines and show how the final NPV moves under each, rather than defending a single “most likely” future as fact. This approach comes from the older but still widely consulted Werkwijzer MKBA van integrale gebiedsontwikkeling, and it remains sound advice for area-scale projects with long time horizons.
Why property uplift and livability need ranges, not point estimates
Property value increases and livability gains are the two effects most likely to sink an MKBA’s credibility, because they are the effects planners are most tempted to overstate. The CPB’s guidance on gebiedsontwikkeling is blunt about this: these effects depend heavily on local context, and applying a generic kengetal (a standard reference value) to a specific neighbourhood produces numbers that look precise but aren’t.
CPB’s recommendations point to a better working method:
- Build three explicit scenarios (optimistic, central, pessimistic) tied to measurable drivers such as housing demand growth, retail vacancy trends, or transport frequency changes.
- Show how each scenario shifts the NPV decision, not just the headline figure.
- Run sensitivity analysis, ideally with a tornado table that ranks which assumptions move the outcome most.
- Keep a combined effect matrix where monetary and non-monetary outcomes sit side by side, so a reviewer sees the full picture at a glance rather than a single blended score.
CPB’s own review lists seven such recommendations, and sensitivity analysis for waardestijging onroerend goed (property value uplift) sits near the top. Treat this not as a bureaucratic formality but as the mechanism that keeps your MKBA defensible when a council member asks “how sure are you about that number?”
Aligning MKBA with MER, broad welvaart, and planning instruments
Running an MKBA in isolation from the milieueffectrapportage (MER) procedure wastes effort and risks two baselines that quietly diverge. Align data collection and the nulalternatief definition across both processes from the outset, so you are not reconciling two competing versions of “what happens without the project” halfway through planuitwerking.
- Set a shared baseline year and shared assumptions for both the MKBA and MER before either study team starts collecting data, following the crosswalk guidance from RWSeconomie’s effects overview.
- Follow the Werkwijzer and the broader Algemene MBA-leidraad in covering broad welvaart categories: not just GDP-adjacent effects, but health, environment, and social cohesion.
- Build in governance discipline: independent peer review, a documented assumption log, formal sign-off before publication, and appendices published alongside the main report rather than held back.
Growing practice also argues for folding resilience and sustainability indicators into the same framework rather than running them as separate exercises, since a systematic review of urban planning literature found that disconnected hazard and sustainability assessments tend to produce conflicting policy signals on long-lived area projects.
How GIS and 3D scenario modelling sharpen MKBA inputs
Most of the effects in an area development MKBA start life as spatial decisions: how much floor area a massing generates, how far shadows fall across a public square, how many parking bays a scheme needs. Getting these numbers right before you value them is where GIS and 3D scenario modelling earn their place in the workflow.
A handful of KPIs translate directly into MKBA inputs or sensitivity axes:
- Development capacity (gross floor area, unit counts, mix of functions).
- Sunlight and shadow changes across public space and neighbouring plots.
- Green ratio and net public green area.
- Parking supply and net change in parking bays.
- Pedestrian connectivity and visibility or sight line metrics.
The practical workflow runs in four moves: import the GIS baseline, build two or three alternative massings, run automated KPI extraction across each, then export the figures directly into the MKBA scenario tables. A short set of spatial KPIs, such as additional floor area, net green area, and projected daily trips, can feed straight into valuation rules or act as the axes for your sensitivity tests.
Pro Tip: When stakeholders disagree about a qualitative effect like “livability,” the disagreement is usually really about the underlying spatial assumption, not the value judgement. Show them the massing in 3D and the argument often resolves itself. Some digital urban planning platforms support this kind of side-by-side scenario comparison, letting planning teams test alternative massings without waiting on a full CAD rebuild for every variant.
How to report MKBA results so councils can decide
An MKBA that sits in a 60-page appendix nobody reads has failed at the one job that matters: helping a council or steering group make a decision. Structure the reporting deliverables around that decision, not around the analytical process.
- Lead with an executive decision page: the verdict in one line, NPV ranges by scenario, the key non-monetary trade-offs, and any distributional flags.
- Attach an assumptions log, sensitivity tables, full data sources, an MER crosswalk, and the spatial KPI exports as appendices, not as afterthoughts.
- Include a visual scenario gallery, a one-page policy brief in plain language, and an annex linking to the 3D scenario views used to generate the KPIs.
| Deliverable | Audience | Core content |
|---|---|---|
| Executive decision page | Council, steering group | Verdict, NPV range by scenario, key trade-offs |
| Assumptions log | Reviewers, auditors | Nulalternatief, valuation choices, data sources |
| Scenario gallery | Public, stakeholders | Massing visuals, sunlight and green space comparisons |
| MER crosswalk appendix | Environmental reviewers | Shared baseline, overlapping effects |
Practitioner perspective: common pitfalls and quick remedies
The MKBAs that run into trouble almost always share the same handful of mistakes, and none of them are exotic. Scoping happens too late, after political commitments are already half made, which leaves the analysis defending a decision rather than informing one. The nulalternatief gets written as a throwaway paragraph instead of a documented, defensible baseline. Property uplift gets quoted as a single confident figure because a single figure is easier to put in a slide deck than a range with three scenarios. And MKBA and MER timelines drift apart until nobody can explain why the two studies use different baseline years.
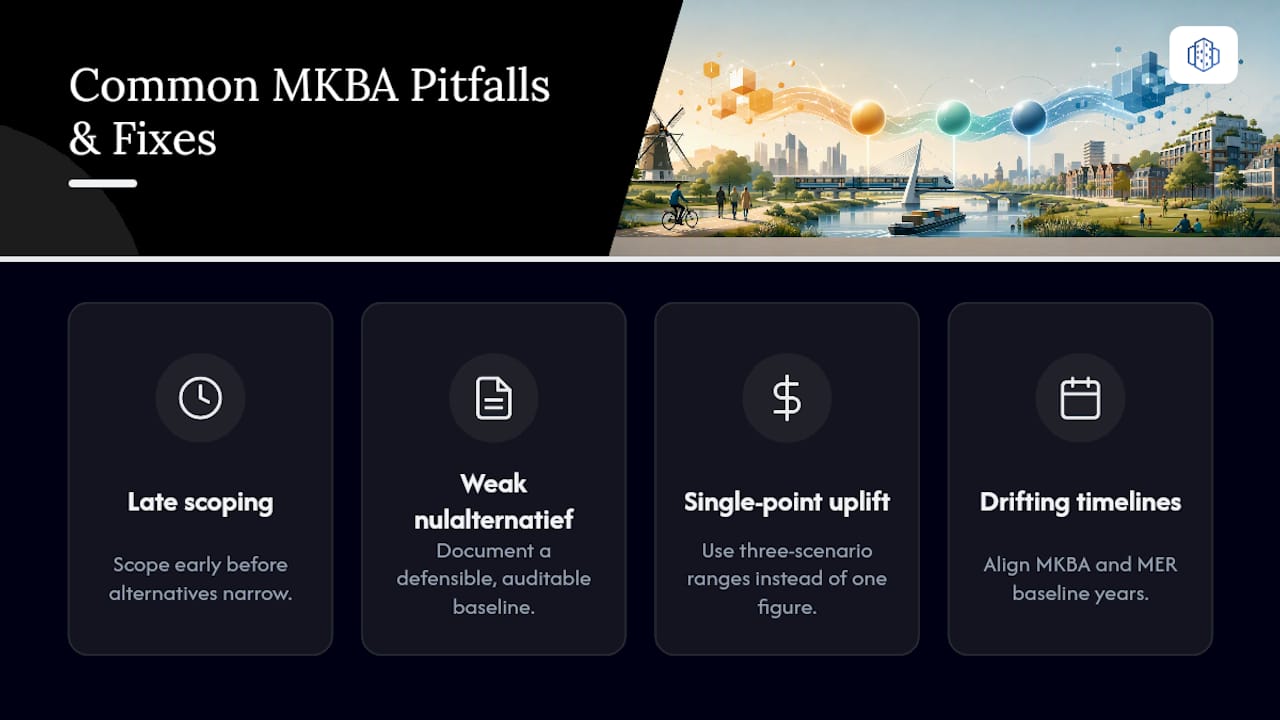
The remedies are unglamorous but effective. Scope early, before alternatives narrow. Run three-scenario comparisons as standard practice rather than an optional extra for contested projects. Make every assumption auditable, meaning a reviewer who wasn’t in the room can trace where a number came from. And visualise the trade-offs, because a council member who can see two massings side by side in 3D asks sharper questions than one reading a paragraph of prose.
Start small where you can. A pilot MKBA feeding into a staged governance process, reviewed and refined at each MIRT gate, builds far more institutional trust than one exhaustive report delivered cold at the end.
— Anne Dullemond
Putting the workflow into practice with 3D Cityplanner
There are browser-based tools that enable planning teams to build massing alternatives and spatial KPIs that can feed directly into an MKBA, without waiting for a full CAD or GIS specialist to turn each variant around. Important features for MKBA work include rapid scenario testing across multiple massings, automated KPI extraction for floor area, green ratio, sunlight, and parking, and visual outputs that help stakeholders calibrate the qualitative effects that usually cause the most disagreement.
If you’re preparing for a verkenning-stage MKBA, a short demo is the fastest way to see whether this fits your workflow. Bring a GIS baseline for the area, two alternative massings you’re already comparing internally, and a short list of the KPIs you need for your effects matrix. The Urban Design Platform page shows how the scenario comparison and KPI export work in practice, and the free trial options let your team test the workflow against a live project before committing to anything.
Sources
For the method rules themselves, start with the Werkwijzer MKBA bij MIRT and the CPB’s toelichting on gebiedsontwikkeling. For effect lists and the MER crosswalk, RWSeconomie’s effects overview is the practical reference.
- Werkwijzer MKBA bij MIRT (Rijksoverheid)
- Toelichting MKBA gebiedsontwikkeling (CPB)
- Integrating sustainability into urban planning: systematic review (MDPI)
- Werkwijzer MKBA van integrale gebiedsontwikkeling (2009)
FAQ
What Is an MKBA in Gebiedsontwikkeling?
An MKBA is a maatschappelijke kosten-batenanalyse, a structured comparison of a project’s costs and benefits against a documented nulalternatief, covering both monetary and non-monetary effects. For area development, it typically follows the effect categories and valuation rules set out in the Werkwijzer MKBA bij MIRT.
When Is a Full MKBA Required for Area Development?
A full MKBA is normally justified for MIRT-scale, publicly financed, or policy-sensitive projects, particularly integrated mixed-use schemes combined with public infrastructure. Smaller or single-function redevelopments with limited public exposure are usually better served by a lighter effects matrix or distributional checklist.
How Should Property Value Uplift Be Presented?
Property value and livability effects should be shown as ranges across optimistic, central, and pessimistic scenarios, never as a single point figure. This follows CPB’s recommendation to use sensitivity analysis rather than uniform kengetallen for context-dependent effects.
Can 3D Modelling Really Feed Into an MKBA?
Yes. Spatial KPIs such as floor area, green ratio, sunlight hours, and parking supply can be extracted from 3D massing alternatives and used directly as MKBA inputs or sensitivity axes, a workflow supported by platforms like 3D Cityplanner.
How Does MKBA Relate to the MER Procedure?
MKBA and MER should share a baseline year and nulalternatief assumptions, set early in the process to avoid duplicate or conflicting studies. The RWSeconomie crosswalk guidance sets out how to align the two.


