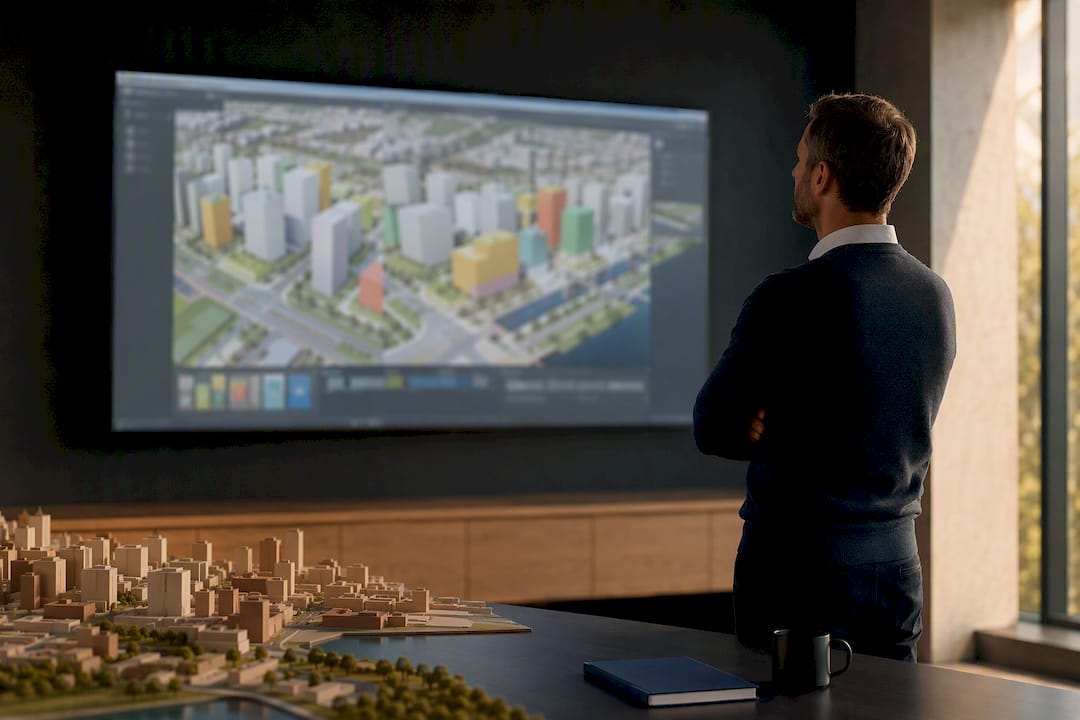
3D infrastructure modelling: run scenarios in hours for Dutch planners

3D infrastructure modelling gives planning teams a way to test building massing, sunlight, visibility and parking scenarios before a single permit is submitted. Done well, it combines national datasets like the 3D Basisvoorziening with parametric massing tools so teams can compare development capacity and other KPIs across options in hours rather than weeks. The rest of this guide walks through the workflow, the data sources that make it reliable, and how to choose a platform such as 3D Cityplanner that supports it end-to-end.
TL;DR:National datasets like 3D Basisvoorziening and BAG enable reliable and scalable base models for early-stage feasibility testing without costly new surveys.Running multiple analyses such as sunlight, shadow, and visibility together on the same scenario reveals trade-offs that could be missed with sequential checks.KPIs for massing, height, shadow impact, and parking ratios should be defined upfront, with parametric models allowing quick scenario adjustments.Platforms like 3D Cityplanner simplify workflow by providing automatic data integration, instant KPI recalculations, and stakeholder-ready visual exports.Avoid modeling an entire city at high detail early on; focus instead on specific sites with limited scenarios to prevent slow, unmanageable projects.
3D CityplannerCompare Urban Scenarios In 3D3D Cityplanner helps planning teams analyse and compare spatial development scenarios, from site feasibility to stakeholder communication.Explore 3D Cityplanner
Table of Contents
- What is 3D infrastructure modelling for scenario planning?
- Which analyses matter most in 3D scenario models?
- Which datasets give you a reliable base model?
- How do you go from data to a stakeholder-ready scenario comparison?
- How do you choose a platform for this work?
- Practitioner perspective: common pitfalls and a compact pilot checklist
- How 3D Cityplanner supports your next scenario study
- Key documents, datasets and studies to consult
- Sources
- FAQ
What is 3D infrastructure modelling for scenario planning?
In this context, 3D infrastructure modelling means building GIS-linked, three-dimensional representations of buildings, terrain and public space to test planning scenarios, not the scan-to-BIM or point-cloud capture used in construction surveying. The two disciplines share a name but solve different problems. One documents what already exists on a construction site; the other explores what could exist on a plot of land, a redevelopment site, or a neighbourhood.
The EU Local Digital Twin (LDT) Toolbox frames this clearly: local digital twins exist for simulation and evidence-based decision-making, not for real-time operational control. That distinction matters for procurement, because it steers municipalities away from sensor-heavy “smart city” platforms and towards tools built for scenario comparison. DIN SPEC 91607 reinforces this from a technical angle, framing digital twins as systems that link stakeholder-specific data to participatory planning, with interoperability and data quality as the foundation.
This approach works best for:
- Early-stage feasibility studies before formal design begins
- Comparing two or three redevelopment options for the same site
- Communicating trade-offs to councillors, residents and investors
- Testing zoning or density assumptions against real terrain and building data
Which analyses matter most in 3D scenario models?
Feasibility work rarely hinges on a single output. It hinges on running several analyses against the same massing model so that trade-offs become visible rather than assumed. A 2025 study on integrated 3D environments for planning found that 3D digital twin scenarios speed up the move from abstract concept to site-specific feasibility precisely because they support these analyses within one model, rather than in separate spreadsheets and CAD files.
- Massing and height compliance — checking proposed volumes against zoning envelopes and neighbouring building heights.
- Sunlight and shadow impact — modelling seasonal sun angles to assess overshadowing on gardens, streets and existing homes.
- Visibility and viewshed analysis — testing sightlines from key vantage points, useful for heritage settings or tall-building assessments.
- Development capacity and plot ratio checks — recalculating floor area ratio and unit counts as massing changes.
- Parking, circulation and public space — verifying that parking ratios and pedestrian routes still work once massing shifts.
- Level of detail decisions — LoD1 (block massing) suits early feasibility; LoD2 (roof shapes, facades) suits stakeholder presentations and shadow studies; higher detail is rarely needed before design development.
Pro Tip: Run sunlight and visibility checks on the same massing iteration, not sequentially. Sequential checks tend to hide the scenario where one analysis passes and the other fails outright.
Which datasets give you a reliable base model?
Assembling this base model well is largely a data assembly problem before it is a modelling one. National base data on 3D Basisvoorziening (Kadaster / PDOK) already provides buildings, terrain and surface models suitable as a starting foundation for city-scale scenarios, without the cost of a fresh survey.
Prioritise these sources, in roughly this order:
- 3D Basisvoorziening (PDOK) for nationwide building and terrain geometry
- BAG for authoritative building footprints, addresses and function codes
- BGT for detailed topography, roads and public space boundaries
- AHN for elevation and terrain height, critical for shadow and drainage checks
- Netherlands3D as an open-source framework that combines these layers into one consistent base
For exchange formats, CityJSON and CityGML carry semantic building data well, 3D Tiles suit large-scale web visualisation, and DSM/DTM rasters handle terrain. Where a scheme links back to detailed building design, IFC remains the bridge to BIM models, though it is rarely the format for city-scale scenario work.
A large-scale solar analysis published in Remote Sensing (2024) found that geometry resolution and face count materially affect computation time at district scale, which is the practical argument for a use-case-first approach: build the national base first, then add high-resolution geometry only inside the project boundary.
How do you go from data to a stakeholder-ready scenario comparison?
A workflow that moves in fixed steps, rather than jumping straight to detailed 3D massing, keeps iteration fast and keeps stakeholders oriented to the same set of facts.
- Define objectives and KPIs first. Decide whether the project is judged on unit count, floor area, parking ratio, overshadowing hours, or a combination, before opening any modelling tool.
- Assemble and clean baseline datasets. Pull 3D Basisvoorziening, BAG and AHN layers for the project area and verify alignment against the current cadastral boundary.
- Build parametric massing and run scenarios. Adjust height, footprint or setback and let KPIs recalculate automatically rather than remodelling from scratch each time.
- Structure work into cases, scenarios and experiments. The EU LDT use-case framework offers a practical way to organise this so scenarios stay comparable rather than ad hoc.
- Generate stakeholder-ready exports. Produce side-by-side visual comparisons, sunlight studies and KPI tables suited to a council presentation or a developer pitch.
- Document assumptions and gather feedback. Record which zoning rule or density target drove each scenario, then feed reactions back into the next iteration.
Research from Eindhoven University of Technology found that stakeholder-specific digital twins improve consensus specifically because residents, developers and planners evaluate the same interactive scenarios rather than static renders sent separately to each group.
How do you choose a platform for this work?
Shortlist platforms against the tasks the workflow above actually demands, not against feature lists that sound impressive but never get used. A practical guide to site analysis makes a similar point for construction projects: the method should match the decision it needs to inform, not the other way round.
- Data integration — can it load 3D Basisvoorziening, BAG and AHN without manual conversion?
- Parametric editing — can massing change without a full remodel each time?
- Scenario comparison — can two or three options sit side by side with KPIs recalculated live?
- Performance — does it stay responsive once local detail is added to a national base layer?
- Stakeholder outputs — does it export visuals and tables non-technical audiences can read unaided?
- Onboarding and support — is there a path from trial to a working first project?
3D Cityplanner is built around exactly this checklist: it runs in the browser with no installation, integrates national and local GIS and 3D data, and lets planners adjust massing parametrically while KPIs update immediately for scenario comparison. Manual recalculation after every massing change is one of the biggest hidden costs in feasibility work, since it quietly slows every iteration cycle.
Pro Tip: Test a platform’s stakeholder export on a real council-style presentation before subscribing. A tool that handles technical KPIs well but produces cluttered visuals will cost you time in every meeting afterwards.
Practitioner perspective: common pitfalls and a compact pilot checklist
The most common mistake in early 3D scenario projects is scale creep: teams try to model an entire city centre at high fidelity before they have agreed what question the model needs to answer. That instinct comes from good intentions, but it produces slow, expensive models that nobody finishes reviewing. The second mistake is weaker but more damaging: skipping the KPI definition step, so scenarios get compared on gut feeling rather than fixed metrics.

Data governance deserves more attention than it usually gets. National sources like BAG and AHN update on their own schedules, so a scenario model built in January can drift from the ground truth by autumn if nobody owns the refresh cycle.
For a first pilot, keep it tight: pick one use case, load national base data only, add high detail solely within the project boundary, run two or three scenarios rather than ten, and prepare visuals before the first stakeholder meeting rather than after.
— Anne Dullemond
How 3D Cityplanner supports your next scenario study
If your current process still means exporting massing studies to static images for every stakeholder meeting, that gap is exactly where 3D Cityplanner is built to help. It runs entirely in the browser, pulls in national and local GIS data automatically, and recalculates development capacity, parking and other KPIs the moment you adjust a massing parameter, so comparing scenarios stops being a rebuild exercise and starts being a live conversation.
For municipalities and consultants who want to test this on a live case rather than a demo dataset, a gebiedsscan gives a fast, structured first look at a specific project area. Teams ready to commit can review the Starter, Professional and Team plans, with current prices listed on the pricing page. Organisations with broader needs can request customised plans with pricing details available on the website. Anyone wanting to see the workflow first can book a demo before choosing a plan.
Key documents, datasets and studies to consult
The sources below back the standards, datasets and research referenced throughout this guide, useful for teams building a procurement case or a technical brief.
- EU Local Digital Twin (LDT) Toolbox — European Commission policy framework for local digital twins
- DIN SPEC 91607 guidance — standard for interoperable, stakeholder-linked digital twins
- 3D Basisvoorziening dataset — national 3D building and terrain data via PDOK
- MDPI study on integrated 3D environments and Remote Sensing solar potential study — peer-reviewed research on scenario modelling and computation scale
Sources
- EU Local Digital Twin (LDT) Toolbox (European Commission)
- MDPI study on integrated 3D environments for planning (2025)
- 3D Basisvoorziening (Kadaster / PDOK)
FAQ
What is 3D infrastructure modelling used for in planning?
It is used to test building massing, sunlight, visibility and development capacity scenarios before formal design begins, so planning teams can compare options on the same KPIs. Platforms such as 3D Cityplanner apply this specifically to feasibility studies and stakeholder communication rather than construction documentation.
Which datasets should I load first for a Dutch project?
Start with 3D Basisvoorziening for building and terrain geometry, then add BAG for footprints and AHN for elevation. This combination avoids costly fresh data capture and gives a reliable base for most feasibility scenarios.
Do I need LoD2 detail for every scenario?
No. LoD1 block massing is usually sufficient for early feasibility and zoning checks, while LoD2 detail, with roof shapes and facades, matters more for shadow studies and stakeholder presentations. Reserve higher detail for the specific project boundary rather than the whole model.
How does 3D Cityplanner fit into this workflow?
3D Cityplanner runs in the browser, integrates national GIS and 3D data automatically, and recalculates KPIs as massing changes, which covers the parametric editing and scenario comparison steps described above. Current pricing details for the Starter plan are available on the pricing page.
What is the difference between a digital twin and a static 3D model?
A static model shows one fixed design, while a digital twin, as framed by the EU LDT Toolbox, supports ongoing simulation and comparison of multiple scenarios against the same base data. That makes it suited to iterative feasibility work rather than a single finished presentation.