Stop FSI Errors Above 8: Calculate FSI for Dutch Planners with RUDIFUN
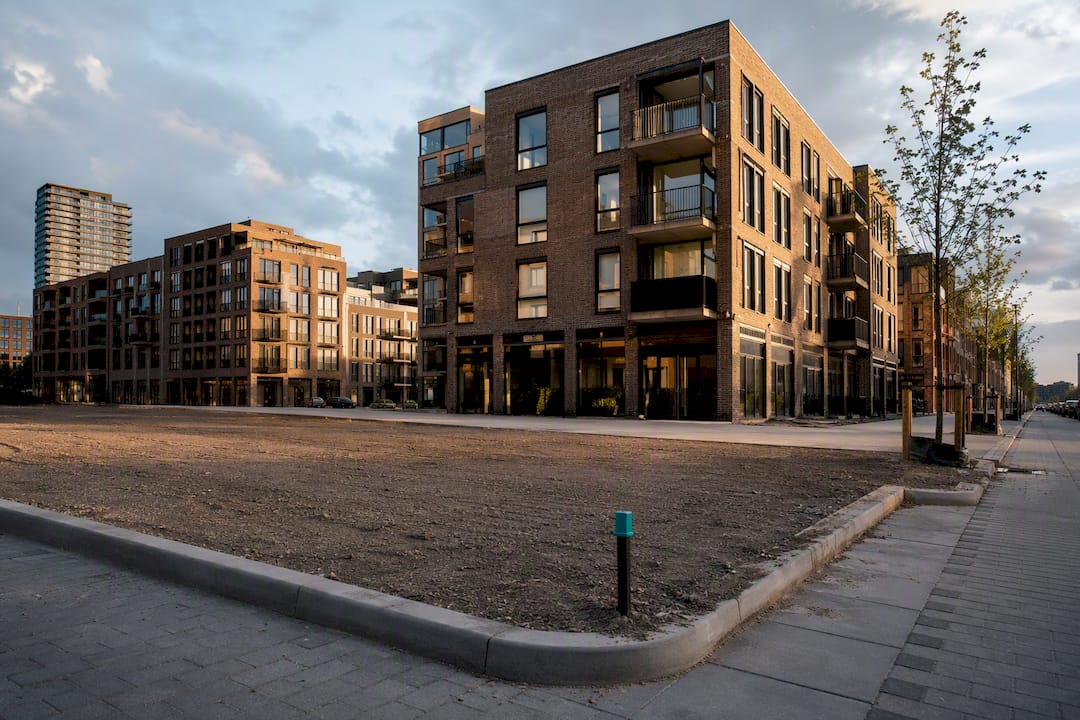
FSI (Floor Space Index) equals total bruto vloeroppervlakte (BVO) divided by the associated terreinoppervlakte. Source BVO from the BAG, converting gebruiksoppervlakte using published kentallen where needed, and take terrain area from cadastral or BGT geometry. FSI is the Dutch equivalent of FAR (Floor Area Ratio) used internationally, and it works alongside GSI (Ground Space Index) to describe building bulk and footprint separately.
TL;DR:Accurate FSI calculations require allocating building floor area proportionally to each terrain segment, especially when buildings span multiple parcels.Ensuring the use of correct source data, particularly filtering out inactive or demolished objects and reconciling parcel boundaries, is critical to avoid major calculation errors.Automating FSI with tools like RUDIFUN ensures reproducibility and consistency across large-scale analyses, avoiding manual misallocations.FSI should be interpreted alongside GSI to understand building massing patterns, with high FSI and low GSI indicating tall, slender structures on open ground.
Table of Contents
- What FSI formally means and which standards define it
- Worked examples: single parcel and multi-terrain allocation
- GSI, L and OSR: what changes as you scale up
- Common pitfalls and a practical QA checklist
- Automating FSI with RUDIFUN and digital twin platforms
- Where to verify FSI methods and data
- Why the RUDIFUN approach should be your default, not your backup
- Sources
- FAQ
What FSI formally means and which standards define it
BVO, the numerator in every FSI calculation, follows the definitions in NEN 2580, the Dutch standard for measuring floor areas in buildings. BVO counts all enclosed floor area within the outer wall lines, including basements, plant rooms, and covered traffic areas such as stairwells and lift shafts. It excludes open balconies and uncovered terraces, which trips up planners who default to gross external footprint measurements instead.
The BAG (Basisregistratie Adressen en Gebouwen) is the canonical national register for building data, but it publishes gebruiksoppervlakte, not BVO directly. The two are related but not identical: gebruiksoppervlakte measures usable floor space per NEN 2580’s narrower definition, while BVO includes structural elements like walls and columns.
Converting between them means applying published kentallen (conversion ratios), a step the RUDIFUN methodology from the Planbureau voor de Leefomgeving (PBL) automates at national scale.
You will see FSI referred to under several names depending on where the analysis originates:
- FAR (Floor Area Ratio) — the standard term in UK, US and most international planning literature
- V/T-index — an older Dutch term (Vloeroppervlak/Terreinoppervlak) still found in some municipal zoning documents
- Floor space index — the direct English translation used in Dutch academic and consultancy work
Planners use FSI because it captures development intensity independent of building height distribution. Two parcels can have identical FSI values with completely different massing: one low and sprawling, one tall and slender. That is precisely why FSI needs GSI alongside it to describe a scheme fully, a relationship covered further below.
Worked examples: single parcel and multi-terrain allocation
A single parcel calculation is straightforward once your inputs are clean. Take a mixed-use plot with a total BVO and terreinoppervlakte where dividing the two gives an FSI around 3.0. That figure alone suggests the site carries about three times its footprint in built floor area, consistent with a mid-rise urban block of several storeys depending on ground coverage.
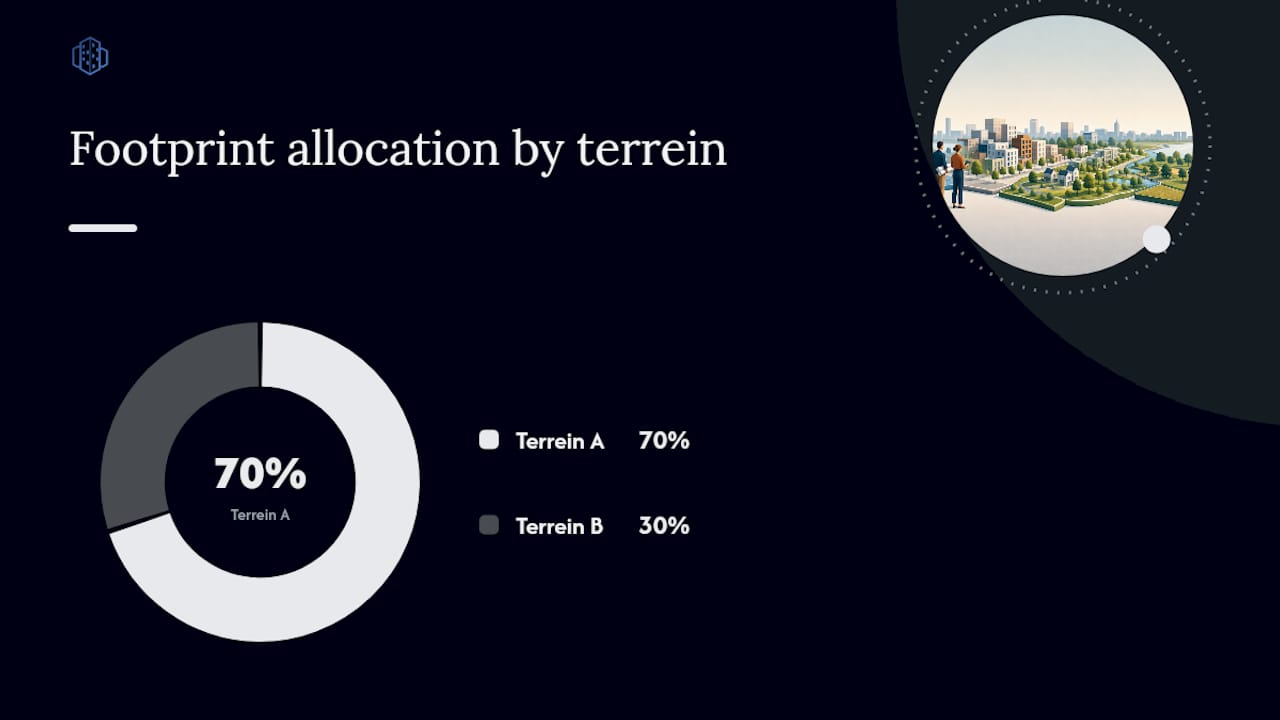
Multi-terrain cases are where most calculation errors creep in. A single building often straddles two or more registered terreinen, particularly on redeveloped inner-city blocks where parcel boundaries predate current construction. The RUDIFUN technical annex resolves this through proportional allocation: BVO is apportioned to each terrein according to the share of the building’s ground floor projection that falls within that terrein’s boundary, not by an arbitrary split.
Say a building with 6,000 m² total BVO sits across two terreinen, with 70% of its footprint on Terrein A and 30% on Terrein B. Terrein A receives 4,200 m² of allocated BVO, Terrein B receives 1,800 m². Each terrein’s FSI is then calculated against its own area using only its allocated share.
- Always allocate by footprint projection percentage, never by a straight area split between terreinen
- Cross-check results using GSI: if FSI divided by GSI produces an implausible average layer count (L), one of your inputs is likely wrong
- Flag any FSI above 8 or below 0.1 for manual review before publishing
Typical ranges: Dutch historic city centres commonly show FSI values well above suburban norms, while post-war suburban areas often sit below 0.5. Use these bands as a sanity check, not a hard rule, since local zoning and typology vary considerably.
GSI, L and OSR: what changes as you scale up
FSI behaves differently depending on the spatial unit you calculate it for, and the standard scale hierarchy in Dutch practice runs from kavel (individual plot) through bouwblok (building block), buurt (neighbourhood), wijk (district), to gemeente (municipality). Aggregation rules matter here: summing BVO and terrain area separately across all parcels in a bouwblok before dividing gives a genuinely different (and usually more accurate) result than averaging individual parcel FSI values.
FSI rarely stands alone in serious morphological analysis. Three related indices complete the picture:
- GSI (Ground Space Index) — building footprint area divided by terrain area, describing ground coverage independent of height
- L (average number of layers) — derived as L = FSI / GSI, giving an effective storey count across the site
- OSR (Open Space Ratio) — calculated as (1 − GSI) / FSI, describing how much open space exists relative to total floor area built
A high FSI with low GSI signals tall, slender buildings on generous open ground. A high FSI with high GSI signals dense, low-rise coverage, the classic historic-centre pattern. RUDIFUN treats anomalies like elevated buildings on stilts or extensive underground infrastructure by excluding non-ground-contact floors from GSI while retaining them fully in BVO, which keeps L meaningful rather than distorted by basements or car park levels beneath open squares.
Common pitfalls and a practical QA checklist
Even experienced analysts trip over the same handful of errors when calculating FSI at scale, most of them traceable to unclean source data rather than formula mistakes.
- Double counting shared building footprints that appear in both BAG and BGT under slightly different geometries
- Inactive BAG objects (demolished, planned, or “niet gerealiseerd” status) inflating totals if status filters aren’t applied
- Tiny outbuildings under 4 m², such as garden sheds, skewing GSI without materially affecting real development capacity
- Mismatched parcel geometry between kadaster and BGT boundaries, especially near property line disputes or recent subdivisions
- Coordinate reference system drift, where layers pulled from different sources default to different projections
Nine times out of ten, an implausible FSI value traces back to a data cleaning gap rather than a genuinely unusual building.* Note this differs from permit-free buildability checks, which use the separate ‘bebouwingsgebied’ concept and its own step-by-step assessment rules rather than FSI thresholds.
Automating FSI with RUDIFUN and digital twin platforms
PBL’s RUDIFUN dataset automates FSI, GSI and related indices across the Netherlands, enabling reproducible, large-scale analysis that supports research into density, liveability and transport outcomes without repeating manual parcel-by-parcel work.
A minimal in-house pipeline mirrors that logic:
- Ingest BAG and BGT data for the study area
- Allocate BVO proportionally where buildings span multiple terreinen
- Convert gebruiksoppervlakte to BVO using kentallen
- Aggregate to the target scale (bouwblok, buurt, wijk)
- Run QA checks on outlier percentiles
This is where 3D Cityplanner fits into the workflow. Once FSI and GSI figures are calculated, importing building footprints and BVO overlays into a 3D scenario lets planners visually verify allocation decisions, spot footprint overlaps at a glance, and compare development scenarios side by side rather than trusting spreadsheet output alone. Read more on benefits of using 3D city models and for urban planners.
| Pipeline stage | Primary data source | Common check |
|---|---|---|
| Floor area input | BAG gebruiksoppervlakte | Filter inactive/demolished status |
| Terrain input | BGT and kadaster geometry | Reconcile boundary mismatches |
| Conversion | IGG kentallen | Confirm NEN 2580 alignment |
| Aggregation | Bouwblok/buurt/wijk boundaries | Sum before dividing, not after |
Pro Tip: Export both the raw allocation table and the final aggregated FSI figures when reporting results, so peer reviewers can trace any individual parcel’s contribution back through the calculation.
Where to verify FSI methods and data
For deeper technical grounding, consult PBL’s RUDIFUN report and technical annex for allocation rules and automation logic. CLO’s national FSI indicator page gives distribution benchmarks, while CBS’s wijk- en buurtkaart supplies boundary datasets for aggregation work.
Why the RUDIFUN approach should be your default, not your backup
Too many FSI calculations in practice still get built manually in a spreadsheet, one parcel at a time, with allocation rules improvised on the spot when a building straddles two terreinen. That approach does not scale, and it is not reproducible: hand someone else the same raw BAG and BGT extracts and ask them to replicate your numbers, and you will often get a different answer.
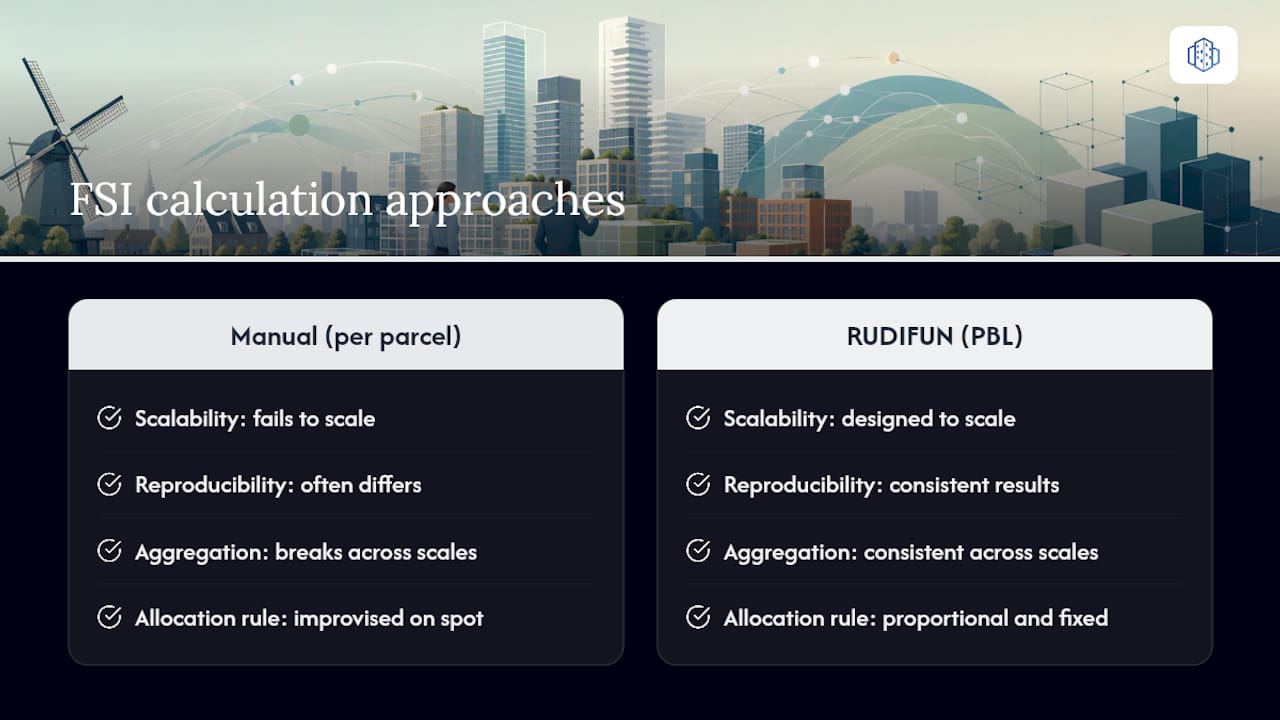
The conventional advice, calculate FSI per parcel and move on, undersells what the index is actually for. FSI only becomes genuinely useful for policy and feasibility work when it is aggregated consistently across bouwblok, buurt and wijk scales, using the same proportional allocation logic every time. That is precisely what PBL built RUDIFUN to solve, and it is worth adopting that discipline even for a single-site feasibility study, not just national research.
My priority for any planner starting this work: get the allocation rule right before you worry about conversion kentallen or coordinate systems. A wrong allocation rule produces confidently wrong numbers at every subsequent scale.
— Anne Dullemond
Sources
Every FSI calculation rests on two pillars: floor area and terrain area. Getting both right means knowing exactly which fields to pull and which to distrust.
For BVO, start with BAG’s oppervlakte field on the verblijfsobject table, which records gebruiksoppervlakte per unit. Watch for two recurring problems: inactive objects (panden marked “buiten gebruik” or demolished but not yet purged) inflating totals, and underground parking or storage entries sometimes missing entirely because they lack a separate address.
For terrain area, BGT (Basisregistratie Grootschalige Topografie) supplies high-precision parcel and building footprint geometry, while kadaster boundaries give the legal parcel extent. These occasionally disagree, particularly along shared property lines or where fencing has shifted from the registered boundary.
- RUDIFUN 2022: Ruimtelijke dichtheden en functiemenging in Nederland
- Ruimtelijke dichtheid, Floor Space Index 2019-2024 (CLO)
- Iplo
Pro Tip: Always calculate area in a projected coordinate system, never in geographic coordinates (latitude/longitude). Running area functions on unprojected BGT or kadaster layers silently produces wrong numbers, often off by a wide margin depending on latitude, and the error rarely looks obviously wrong at first glance.
FAQ
How do you calculate FSI?
Divide total bruto vloeroppervlakte (BVO) by the terreinoppervlakte of the associated parcel: FSI = BVO ÷ terreinoppervlakte. Source BVO from BAG data converted using NEN 2580 principles, and terrain area from kadaster or BGT geometry.
What is FSI?
FSI (Floor Space Index) measures development intensity by expressing total floor area as a ratio of land area, equivalent to the international FAR (Floor Area Ratio) metric. An FSI of around 3.0 suggests a site carries about three times its footprint area in total built floor space, consistent with a mid-rise urban block of several storeys depending on ground coverage.
What is the difference between FSI and GSI?
FSI measures total floor area relative to terrain area, while GSI (Ground Space Index) measures only ground-floor footprint relative to terrain area. Dividing FSI by GSI gives the average number of layers (L) across a site.
What FSI value counts as high density?
There is no universal threshold, but Dutch historic city centres typically show markedly higher FSI values than post-war suburbs, which often sit below 0.5. Context, building typology and local zoning matter more than any single cutoff.
Why does BVO differ from BAG’s gebruiksoppervlakte figure?
BAG publishes gebruiksoppervlakte, a narrower usable-area measure under NEN 2580, while BVO includes structural elements like walls, columns and covered traffic areas. Converting between them requires published kentallen rather than treating the two figures as interchangeable.