Defend CROW parkeerkencijfers: a 5 month checklist for Dutch planners
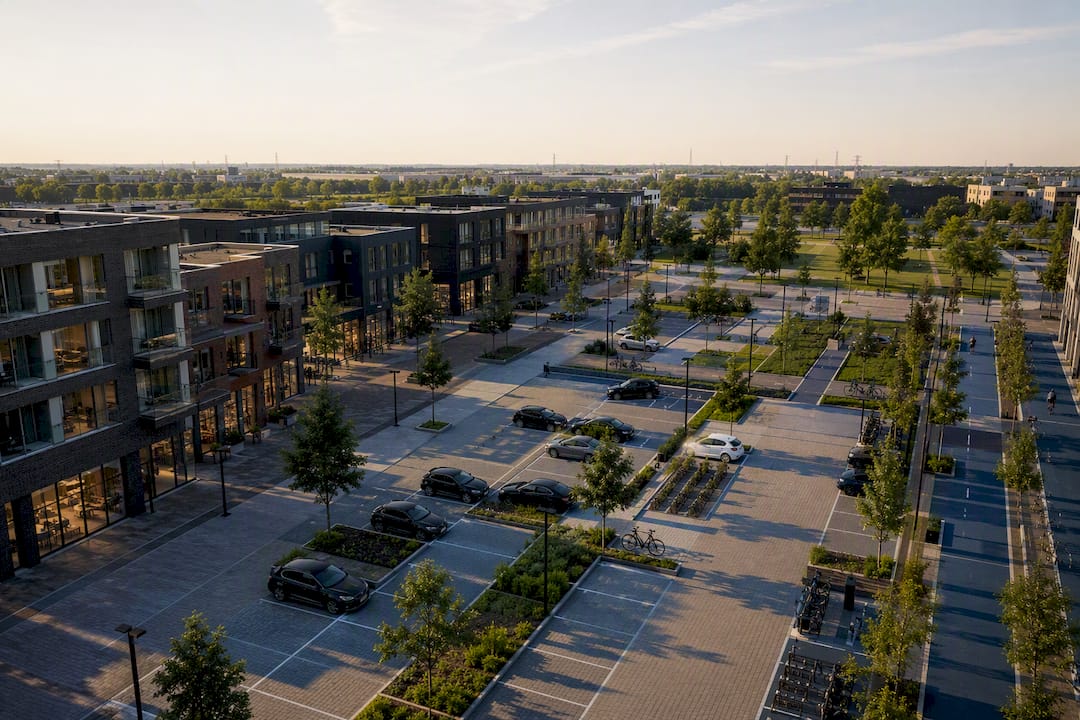
CROW parkeerkencijfers are the national evidence base for translating expected parking demand into municipal parkeernormen. Use the Parkeerkencijfers 2024 publication, the Parkeervraagcalculator and the accompanying handreiking together, then run your site through the calculator before drafting anything. That single export becomes the backbone of your parkeernota and the starting point for scenario testing.
TL;DR:The 2024 CROW parking demand figures now include integrated data for both cars and bicycles across various land use types and location contexts.Local planners must narrow the national kencijfer bandwidths by adjusting for site-specific indicators like actual car ownership and modal split to create defensible norms.Using the Parkeervraagcalculator and 3D visualisation tools helps stakeholders understand space savings, housing capacity, and visual impacts associated with different parking layouts.Updating parking norms involves a detailed multi-month process with clear ownership, culminating in documented decisions supported by visual scenarios for council approval.Deviating from the national figures is legitimate if backed by concrete local evidence, and the use of visual massing models facilitates stakeholder buy-in and transparent decision-making.
Table of Contents
- What the CROW parkeerkencijfers 2024 include and why the update matters
- Stepwise method to translate CROW kencijfers into local parkeernormen
- How to use the CROW Parkeervraagcalculator and companion tools in practice
- Municipal checklist: roles, timeline and key decisions for adopting updated parkeernormen
- Testing kencijfers in a digital twin before the norm goes to council
- Parkeernormen are a starting point, not the destination
- Run your own kencijfers scenario before the next council round
- Sources
- FAQ
What the CROW parkeerkencijfers 2024 include and why the update matters
The 2024 edition covers car and bicycle parking demand across various land use typologies, from starter housing and senior living to retail, offices, and healthcare. Each typology is categorized by location type (urban centre, suburban, rural) and includes a range of kencijfers per unit, allowing planners to consider different development contexts.
The update matters because household car ownership patterns have shifted since earlier editions, and this version incorporates bicycle parking figures as a standard companion dataset rather than a separate appendix. Municipalities using outdated tables may misestimate car and bicycle parking needs, which can lead to imbalances in mixed-use redevelopment.
Trust in the source matters here: the publication carries an ISBN and a fixed release date of 22 July 2024, and CROW sells the full PDF and print edition directly.
- Car and bicycle kencijfers in one integrated publication
- Typologies segmented by housing type, visitor profile, and business use
- Location-type differentiation (centre, suburban, rural or “rest bebouwde kom”)
- Explanatory chapters on how to apply and adjust the figures locally
Stepwise method to translate CROW kencijfers into local parkeernormen
A kencijfer is not a norm. It is a bandwidth drawn from national research, and your job as a municipal planner is to narrow that bandwidth using local evidence. The handreiking parkeernormen exists precisely to guide that step, and skipping it is how norms end up challenged at appeal.
Start by gathering the decision inputs that will shape your final figure: the building’s function, expected household composition, local modal split data, and the type of parking (on-street, courtyard, or structured garage). These four inputs determine which end of the kencijfer bandwidth applies to your site.
- Select the relevant kencijfer range for the function and location type.
- Adjust for local indicators, such as measured car ownership per household or public transport accessibility.
- Apply demand modifiers for shared mobility, visitor parking policy, or age-restricted housing.
- Round the result to a workable norm and document every adjustment made along the way.
Deviating from the national average is legitimate when you can back it with evidence: local parking counts, an adopted modal shift policy, or active parking management measures such as paid permits or shared-use agreements with a neighbouring development. Without that paper trail, a lower norm reads as arbitrary the moment a developer or resident objects.
Pro Tip: Keep a one-page justification sheet per project that lists the base kencijfer, every adjustment applied, and the source of each modifier. It turns a defensible decision into a documented one, which is what actually survives a council debate.
How to use the CROW Parkeervraagcalculator and companion tools in practice
The Parkeervraagcalculator turns the printed tables into a working scenario tool. You feed it a programme (number of dwellings, retail floor area, office square metres), select the location type, and it returns a parking demand range for cars and bicycles combined.
Typical inputs include the mix of unit types in a new housing scheme, whether the project is new build or a conversion of existing floorspace, and whether the site sits in a mixed-use context where residential and commercial peaks overlap. The tool was updated to add bicycle kencijfers and later integrated the full 2024 auto kencijfers, so a scenario run today reflects combined demand across both modes rather than treating them separately.
What this means in practice: a mixed residential-retail block that once needed two separate lookups now produces one demand profile, making it easier to spot where resident and visitor peaks actually overlap during evenings and weekends.
Export the full result set, not just the headline figure, and check three things before filing it in your parkeernota:
- The split between resident and visitor demand, since visitor spaces are often shared with neighbouring uses
- Peak-hour timing, which flags whether office and residential peaks genuinely clash
- The bandwidth width, which tells you how much local adjustment room you actually have
Municipal checklist: roles, timeline and key decisions for adopting updated parkeernormen
Updating a parkeernormenbeleid is a cross-departmental job, not a single planner’s spreadsheet exercise. A realistic timeline runs over several months and needs clear ownership at each stage.
- Month one, planning department: run baseline scenarios through the Parkeervraagcalculator for representative site types across the municipality.
- Month two, traffic and mobility team: review modal split assumptions against local mobility policy and flag districts where deviation is justified.
- Month three, legal affairs: draft the amended norm text and check it against the Omgevingswet participation requirements for public consultation.
- Month four, stakeholder engagement: consult developers, enforcement teams, and residents on draft norms before council submission.
- Month five, council: present the evidence base, including documented deviations, for formal adoption.
Developers need early visibility on which norm applies to their scheme, transport planners need input on modal shift ambitions, and enforcement teams need to flag where existing on-street capacity is already stretched. Record the trade-offs explicitly: a lower parking norm can free up land for housing or green space, but it shifts cost and risk onto public street capacity if visitor parking is under-provided. Decision documents that show this trade-off in figures, not just intentions, hold up far better under scrutiny.
Testing kencijfers in a digital twin before the norm goes to council
Running numbers through a calculator tells you the demand. It does not show a council member what a car park actually does to a street. A practical workflow closes that gap: import the site’s GIS base, assign the intended building programme, apply the relevant kencijfers per unit type, then generate parking layouts and a 3D visualisation of the result.
- Space savings from alternative parking configurations become visible as massing, not just square metres
- The housing capacity gained by trimming surface parking shows up directly in the model
- Impact on public space, greenery, and visibility is something stakeholders can see rather than infer from a table
Pro Tip: Export the massing comparison alongside your Parkeervraagcalculator result. A council member who can see the difference between two parking layouts approves a deviation far faster than one reading a percentage in a memo.
Parkeernormen are a starting point, not the destination

Treating a kencijfer as a fixed rule is the most common mistake in Dutch parking policy, and it usually comes from reading the tables in isolation rather than as one input among several. CROW itself frames the figures as a basis for local judgement, and that judgement has to weigh housing targets, climate adaptation, and street-level liveability alongside raw demand numbers.
The municipalities getting this right are the ones pairing the kencijfers with visual scenario output, because a number on a page rarely convinces a sceptical alderman, but a side-by-side massing comparison usually does. That is also where deviation decisions earn genuine stakeholder buy-in rather than grudging sign-off. For a broader view of how parking trade-offs fit into wider design decisions, see our urban design strategies for modern planners.
— Anne Dullemond
Run your own kencijfers scenario before the next council round
3D Cityplanner gives municipal teams a faster route from a Parkeervraagcalculator export to a council-ready visual, without waiting on a separate CAD or GIS specialist to build the massing model by hand.
The platform imports your GIS base directly, lets you apply the building programme and CROW kencijfers you have already calculated, and generates 3D parking layouts alongside the wider development scenario, so space savings and housing capacity gains are visible in the same view stakeholders will see in the council chamber. That turns a documented deviation from the national bandwidth into something a planning committee can actually inspect, rather than take on trust. If your municipality is preparing an updated parkeernormenbeleid, explore the urban design platform and request a trial on a real local site through the free trial programme for municipalities.
FAQ
What are the CROW norms for parking spaces?
CROW norms, or parkeernormen, are municipal parking requirements derived from the national CROW kencijfers, adjusted using local car ownership data, modal split, and parking management policy.
What are CROW kencijfers exactly?
CROW kencijfers are national reference figures showing expected car and bicycle parking demand per building type and location, published as bandwidths rather than fixed numbers so municipalities can adjust them locally.
Do municipalities have to use the 2024 edition?
There is no legal requirement, but CROW advises using current kencijfers rather than outdated ones, since older tables tend to conflict with current housing and sustainability targets.
Can a municipality set a norm lower than the CROW kencijfer?
Yes, provided the deviation is documented with local evidence such as measured car ownership, an adopted mobility policy, or active parking management measures.
How does a digital twin help with parking norm decisions?
A digital twin such as 3D Cityplanner visualises the massing and space impact of a chosen parking norm directly on the site, making deviations easier for councils and stakeholders to evaluate than a table of figures alone.