Make Permit Ready Sunlight Studies for Planners Using 3D Digital Twins
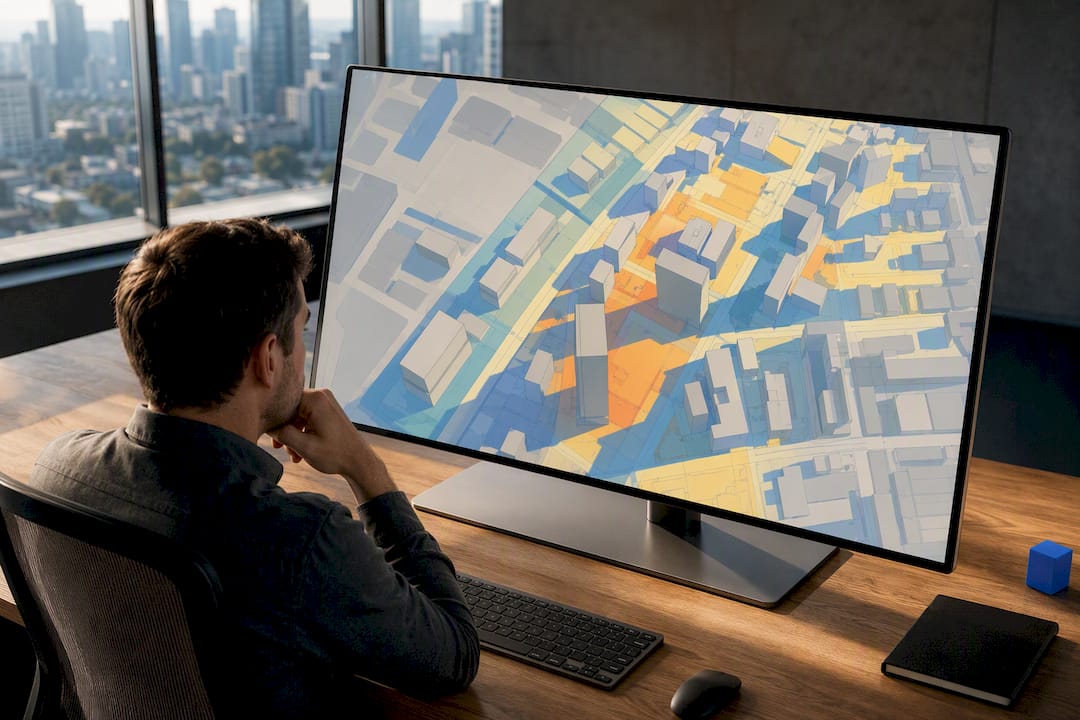
Commissioning a bezonningsstudie produces a permit-ready 3D model, shadow animations and a compliance report you can submit to the municipality or use in neighbour consultations. Run it early in the design phase, before the omgevingsvergunning submission, so massing decisions can still change. The best practice combines municipal sunlight norms, interactive 3D modelling and clear methodology documentation.
TL;DR:The timing of commissioning a bezonningsstudie influences whether it guides design adjustments or only defends decisions, with early studies offering the most flexibility.The quality of data inputs, including accurate site coordinates, existing building footprints, and vegetation, critically determines the reliability of shadow and sunlight impact results.Complying with local norms requires verifying which standards the municipality has adopted, the measurement points required, and the specific test dates before modelling.Using digital twin platforms like 3D Cityplanner streamlines scenario testing and allows for interactive, stakeholder-friendly shadow analysis, reducing costly redesigns.Treating the bezonningsstudie as a design tool rather than mere compliance paperwork encourages better transparency and fewer objections from neighbors and authorities.
3D CityplannerTest Sunlight Scenarios EarlierUse 3D Cityplanner to analyse and compare urban development scenarios with 3D models, sunlight, visibility and spatial data.Explore 3D Cityplanner
Table of Contents
- What is a bezonningsstudie and why does it matter?
- When should you commission a study, and how does it cut risk?
- What TNO norms and municipal policy should you check?
- How do you build the model, run the tests and validate the results?
- What should the report include and how do you present it?
- How interactive 3D and digital twins speed up sunlight studies
- The shift from compliance box-ticking to design tool
- Producing permit-grade studies with 3D Cityplanner
- Where to check the rules and methods yourself
- Sources
- FAQ
What is a bezonningsstudie and why does it matter?
A bezonningsstudie is a 3D analysis of sunlight and shadow across existing and proposed conditions, built from GIS data, building heights and orientation to calculate light patterns at fixed time intervals throughout the year. The output is not a single image but a dataset: a series of shadow positions tied to specific dates and times, from which diagrams, tables and animations are drawn.
The study serves three distinct audiences, and each expects something slightly different from it.
- Municipal permit officers need evidence that a proposed development meets local bezonningsbeleid before an omgevingsvergunning is granted.
- Neighbours and residents often request the study as evidence in disputes over lost daylight to gardens, terraces or living-room windows.
- Design teams use it earlier, as an optimisation tool, to test how a shift in massing or orientation changes shadow outcomes before a design is locked in.
Architects, developers and planning consultants are the typical requestors, but municipalities increasingly ask for one as a standard submission item on medium and large residential schemes. The distinction matters: a study built to defend a design against objections looks different from one built to shape the design in the first place.
When should you commission a study, and how does it cut risk?
Timing determines whether a bezonningsstudie is a design tool or a defensive document. Run it too late and you are locked into a massing decision that a shadow diagram cannot undo.
- Concept or feasibility stage — test massing options against sunlight outcomes before committing to a footprint or building height. This is where a shift in orientation of a few degrees, or a stepped roofline instead of a flat one, can resolve a shading conflict at near zero cost.
- Pre-application stage — run the study against the specific municipal norm and test dates once the design is fixed enough to model accurately, but before formal submission.
- Permit submission — attach the finished report and animations as supporting evidence for the omgevingsvergunning.
- Post-completion disputes — commission a study reactively when neighbours contest completed or under-construction work, though this is the costliest and least flexible point to start.
Early studies change real decisions: a taller volume moved to the north edge of a plot, a lower podium along a garden boundary, or a courtyard reoriented to hold winter sun. Running a study early is commonly recommended as a risk-mitigation strategy because it surfaces shading conflicts while the design is still fluid, well before objections, appeals or legal proceedings can stall a project.
What TNO norms and municipal policy should you check?
Most Dutch municipalities assess sunlight adequacy against TNO norms, commonly referred to as the “lichte” (light) norm and the “strenge” (strict) norm. Both test whether a dwelling receives enough direct sunlight at defined points, but the precise hours and days assessed can vary.
Statistic callout: Bezonning is typically measured at the centre of the living-room window sill, on the interior side of the glass, rather than at the façade or garden level. Getting this measurement point wrong is one of the most common reasons a study is rejected or challenged.
The norms serve as guidelines rather than binding national law. Municipalities adopt, adapt or tighten them through their own local bezonningsbeleid, so the same design may comply in one municipality and not in another. Before modelling anything, confirm:
- Which norm the municipality has adopted (light, strict, or a locally modified version).
- The exact measurement points required (window sill, garden level, balcony).
- The test dates the municipality specifies, since some list dates beyond the TNO defaults.
- Whether existing buildings are exempt or subject to the same standard as new development.
Document the chosen standard explicitly in the report’s methodology section, including its source and the date it was checked, so a reviewer can verify which rule set the compliance table was measured against.
How do you build the model, run the tests and validate the results?
A reliable bezonningsstudie depends on the quality of the data going in as much as the modelling itself. Missing a fence line or an outdated building footprint can shift a compliance result from pass to fail.
Data inputs to gather first:
- Site coordinates and orientation, taken from cadastral records.
- A 3D city model base, such as 3DBAG, combined with AHN elevation data for terrain.
- Cadastral footprints and, where available, the permit drawings for neighbouring buildings.
- Trees, hedges and fences, since professional practice treats these shading objects as part of the model, not an afterthought.
Modelling steps:
- Build the existing situation as a 3D scene, then build the proposed scenario alongside it for direct comparison.
- Set true north orientation and select test dates. A standard study often uses dates such as 21 June and 21 March to capture the solstice extreme and a typical mid-year condition, plus any project-specific dates the municipality lists.
- Run animations at 15-minute intervals from sunrise to sunset for each test date, producing comparison frames for existing versus proposed conditions.
- Extract the compliance data at the defined measurement points for each frame.
Validation checklist: tie the model’s geometry directly to the supplied permit drawings, sections and elevations, so a municipal reviewer or a neighbour’s consultant can reproduce your results independently. Keep a written assumptions table listing every simplification made (tree canopy density, fence heights, unmeasured structures). Where vegetation or roof geometry is complex, an on-site check beats a desktop assumption every time.
Pro Tip: Run the “existing” scenario first and lock it as a baseline before touching the proposed massing. Comparing two moving models invites errors that a fixed baseline avoids entirely.
What should the report include and how do you present it?
A bezonningsstudie report needs to work for two very different readers at once: a permit officer scanning for compliance, and a neighbour trying to understand what changes for their garden.
Core deliverables:
- Shadow diagrams for each test date, at intervals fine enough to show the transition, not just morning/midday/evening snapshots.
- Sunrise-to-sunset animations comparing existing and proposed conditions side by side.
- A compliance table showing each measurement point against the applicable norm.
- A methodology section covering data sources, assumptions, and the standard applied.
The report should read as an argument, not a dump of frames: methodology, data sources, assumptions, results, then a conclusion that states clearly whether the proposal complies and, where it does not, what design adjustment would resolve it.
| Audience | Best format | Why it works |
|---|---|---|
| Municipal reviewer | Concise PDF with compliance table | Fast to check against the adopted norm |
| Neighbours | Interactive 3D walkthrough or animation | Shows shadow behaviour dynamically rather than as a static frame |
| Design team | Full model with scenario comparison | Supports iteration, not just sign-off |
Interactive formats support more nuanced conversations than static diagrams when presenting to municipal boards or neighbours, particularly where the dispute concerns a specific hour of the day rather than the overall daily total.
How interactive 3D and digital twins speed up sunlight studies
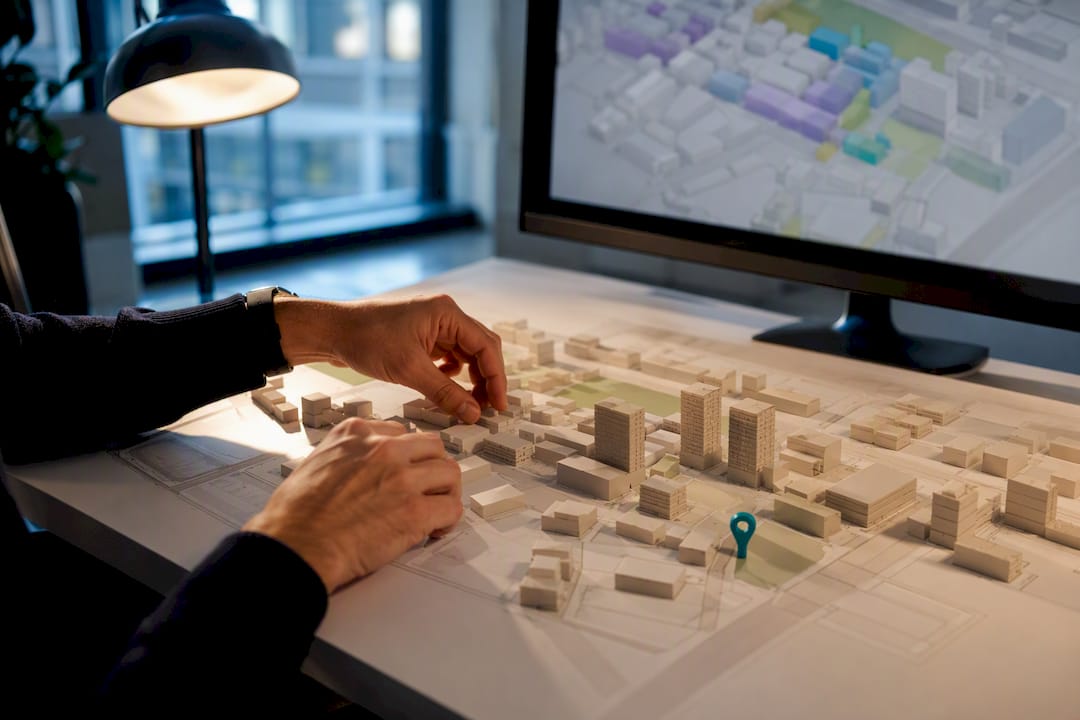
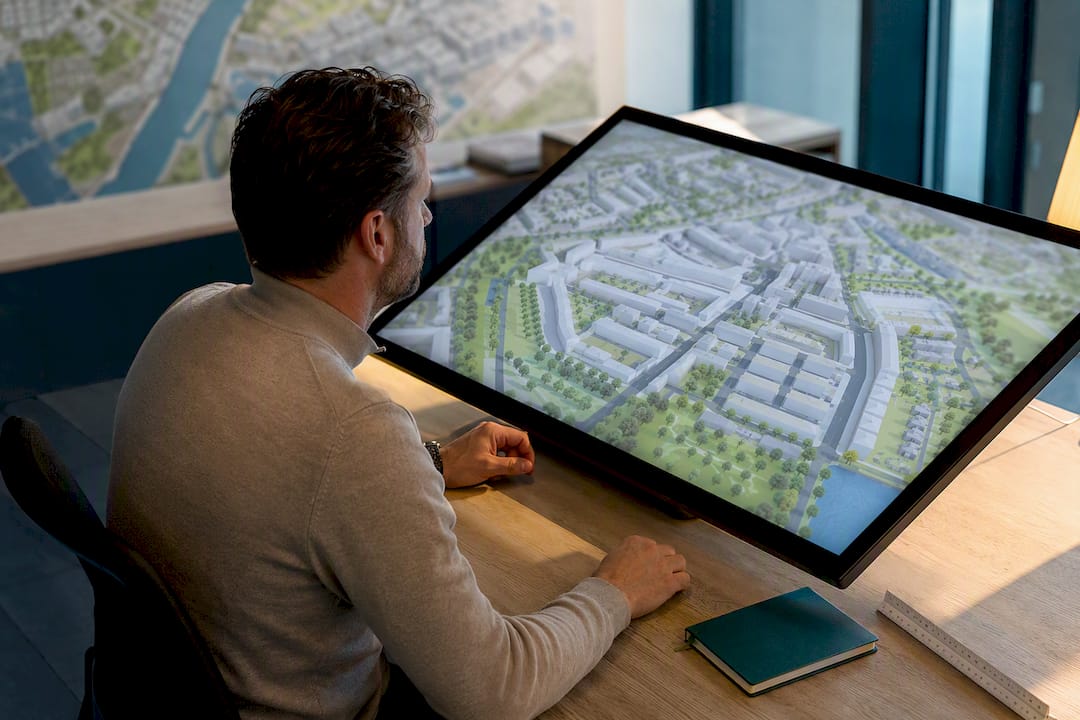
A browser-based digital twin platform changes the mechanics of running a bezonningsstudie without changing what the study needs to prove. Instead of rebuilding a scene from scratch for each scenario, a planner working in a tool like 3D Cityplanner can import GIS layers, 3DBAG building data and cadastral footprints directly, then generate massing options and run shadow animations against the same base model.
Practical tasks the workflow supports:
- Importing existing GIS, 3DBAG and Kadaster data as a starting scene rather than modelling terrain and footprints manually.
- Generating and adjusting massing quickly to test how a height or setback change affects shadow outcomes.
- Producing sunlight and shadow animations automatically across the required test dates.
- Comparing multiple scenarios side by side for a stakeholder meeting, rather than presenting one fixed option.
Pro Tip: Use the digital twin scenario comparison during the feasibility stage, before the permit-stage study is commissioned. It is far cheaper to test five massing options in a model than to redesign after a formal study flags non-compliance.
None of this replaces judgement. Automated software performs the calculations, but expert interpretation against local municipal policy remains the core of the service that a planner or architect provides.
The shift from compliance box-ticking to design tool
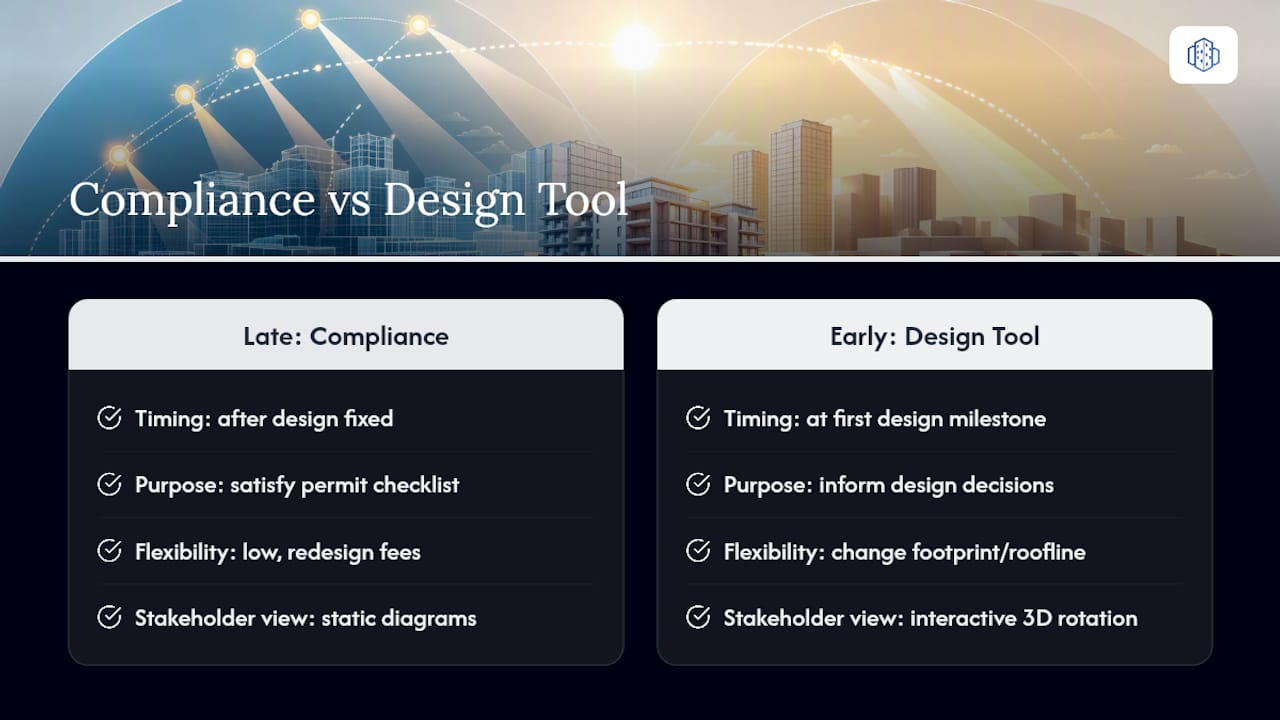
Too many teams still treat the bezonningsstudie as a document to produce after the design is fixed, purely to satisfy the omgevingsvergunning checklist. That habit gets projects into trouble. The real value sits earlier, when a scenario comparison can still change a footprint or a roofline without costing a redesign fee.
Interactive 3D outputs also change the politics of a project. A neighbour who can rotate a model and watch their own garden through a full day understands a shadow claim far better than one reading a static diagram, and that transparency tends to produce fewer, better-informed objections. Sunlight analysis deserves a seat at the first design milestone, not the last.
— Anne Dullemond
Producing permit-grade studies with 3D Cityplanner
3D Cityplanner gives planners and architects a faster route to the workflow described above, without the manual rebuild that static-diagram methods require. Because it works from live GIS and 3DBAG data inside one browser-based model, the same scene used for early massing tests can be extended into the shadow animations, comparison frames and compliance table a municipality expects.
The platform supports the tasks that make a bezonningsstudie defensible: GIS integration, 3D massing generation, sunlight and shadow tooling, scenario comparison and exportable reports for both permit files and stakeholder meetings. If your current process still relies on rebuilding a model for every design iteration, that is the exact friction the platform is built to remove. Explore the urban design platform or start with a free trial and export a sample sunlight report on your own project data to see how it fits your permit workflow.
Where to check the rules and methods yourself
Verify local bezonningsbeleid and adopted norms directly with your municipality or via Rijksoverheid.nl, since requirements vary by council. For a step-by-step look at modelling practice, including test dates and shading objects, see the ZONNESTUDIE methodology guide. To test the workflow on a live project, try the 3D Cityplanner demo.
Sources
FAQ
How can I simulate shadow on a proposed building?
Build a 3D model of the existing and proposed situation using GIS and elevation data, then run shadow calculations at 15-minute intervals across fixed test dates such as 21 June and 21 March.
How do I determine the sun position over my garden?
Model your plot and surrounding buildings in 3D, set true north orientation, then generate a sunrise-to-sunset animation for the dates that matter most, typically the summer and spring equinox reference points used in Dutch bezonningsstudies.
How can I calculate the shadow cast by my building?
Combine a 3D model of the building’s massing with elevation and orientation data, then run a time-sampled shadow simulation against defined measurement points, usually the centre of a neighbouring window sill.
How can I tell whether my house faces south?
Check the building’s orientation against true north using cadastral or GIS data; a south-facing façade typically receives the most consistent direct sunlight across the day, which a bezonningsstudie will show clearly in its shadow diagrams.
Is a light or strict TNO norm used for most projects?
It depends entirely on the municipality: some adopt the lighter TNO norm, others the stricter version or a locally modified standard, so always confirm the adopted bezonningsbeleid before modelling rather than assuming a default.
Recommended
- Digital Twin Technology: Transforming City Planning Impact – 3D Urban Development
- Step-by-step city planning: 3D tools and real-time strategies – 3D Urban Development
- Urban digital twins: enhance planning with virtual cities – 3D Urban Development
- How to plan urban redevelopment with 3D digital twins – 3D Urban Development