Turn Official Dutch Plan Data Into Publishable Zoning Maps

The fastest, legally sound way to visualise a bestemmingsplan starts with the official verbeelding on Ruimtelijkeplannen.nl or the Omgevingsloket, never a screenshot from a third-party site. For a quick address check, use a map portal; for stakeholder meetings or feasibility work, convert that data into a styled 2D map or a 3D massing model. Every version you publish needs a legend, a data date, and a link back to the official planregels.
TL;DR:Official Dutch zoning maps and planregels are legally valid only when sourced from Ruimtelijkeplannen.nl or the Omgevingsloket, not third-party sites.Visualisation portals like Atlas Leefomgeving and Maps Amsterdam show simplified zoning layers, but may not reflect recent amendments or complex designations clearly.2D verbeelding remains the legal standard, while enhanced 2D maps and 3D models serve different communication needs, with 3D best used for scenario analysis and public consultation.Automating data conversion and styling processes improves consistency and efficiency for multiple plans, especially when creating massing models or visual comparisons.Clear documentation of data sources, plan version, and links to official rules is crucial to ensure public trust and prevent disputes over outdated or inaccurate visuals.
3D CityplannerTurn Plan Data Into Clear 3D Scenarios3D Cityplanner helps planners, developers and municipalities analyse spatial development with GIS data, 3D city models and scenario planning.Explore 3D Cityplanner
Table of Contents
- Where to find official plan verbeelding and planregels in the Netherlands
- What common map portals actually show
- Choosing between 2D verbeelding, enhanced 2D and 3D digital twins
- Step-by-step workflow: from official plan file to publishable visual
- Best practices for clarity, accuracy and public communication
- A planner’s view: from screening to a stakeholder-ready visual
- How 3D Cityplanner supports this workflow
- Sources
- FAQ
Where to find official plan verbeelding and planregels in the Netherlands
Ruimtelijkeplannen.nl remains the primary register for bestemmingsplannen: it hosts the legally binding verbeelding (the coloured map) alongside the planregels that govern what can actually be built. As municipalities transition under the Omgevingswet, the Omgevingsloket increasingly takes over this role, consolidating plans, environmental permits and local rules into a single lookup. Both platforms carry legal weight; everything else is a convenience layer built on top of them.
For day-to-day work, you rarely need to start there. Use these instead, then trace back to the legal source before publishing anything:
- Atlas Leefomgeving, Omgevingsplankaart, Bestemmingsplan-inzien — fast address or postcode lookups showing bestemming and plangrens
- Municipal viewers such as Maps Amsterdam — local layers, contact details and styling specific to that city
- Ruimtelijkeplannen.nl / Omgevingsloket — the authoritative fallback whenever a rule needs citing in a report or planning application
If a client or council member asks “is this legally accurate?”, the answer only holds if it traces back to one of those two official sources.
What common map portals actually show
Atlas Leefomgeving and Bestemmingsplan-inzien render the plangrens and enkelbestemming using the standard SVBP colour palette, so a residential zone, a bedrijventerrein and a groenbestemming are visually distinct at a glance. That consistency matters when you are flicking between plans from different municipalities in one working session. Omgevingsplankaart adds an address search on top, which is genuinely useful when a developer hands you a street number and nothing else.
Maps Amsterdam goes further for that municipality specifically, layering in extra local datasets and offering styling notes that some teams reuse for internal presentation maps.
Three limitations catch out planners who trust these portals blindly:
- Older bestemmingsplannen are sometimes still scanned PDFs rather than vector verbeelding, so the “map” is really an image
- Dubbelbestemmingen (overlapping designations such as archaeology or water defence zones) don’t always render clearly in third-party viewers
- Third-party portals can lag behind the official register after a plan amendment, so a recently approved change might not show yet
Treat these portals as excellent screening tools, not as the final word on legal content.
Choosing between 2D verbeelding, enhanced 2D and 3D digital twins
The right output depends on who is looking at it and what decision they need to make.
- 2D verbeelding is the legal baseline. It’s fast to produce, matches the official plan exactly, and is the only format that carries unambiguous legal weight in a planning dispute.
- Enhanced 2D adds styled basemaps, annotated PDFs, and click-to-reveal pop-ups showing planregels text alongside the coloured zone. This is the sweet spot for inspraakavonden and council presentations where residents need to understand a plan without reading legal text.
- 3D massing and digital twins communicate building heights, shadow impact and street-level scale far better than any flat map. Research from a Groningen case study found that 3D genuinely improves how people grasp maximum permitted heights, but only when the model includes surrounding buildings for context and a legend explaining what each colour or height band means. Without that framing, a 3D block can look more like a finished design than a legal envelope, which invites misreading.
Pro Tip: Reserve full 3D for scenario comparison and public consultation. For internal legal checks or quick due diligence, a well-labelled 2D map answers the question faster and avoids any risk of the model being mistaken for an actual building proposal.
Interactive web views work best when an audience needs to explore several parcels or scenarios themselves; static PDFs still win when the output needs to sit in a formal planning document or be archived unchanged.
Step-by-step workflow: from official plan file to publishable visual
- Identify the authoritative plan. Locate it on Ruimtelijkeplannen.nl or the Omgevingsloket, and note the plan ID, adoption date and the direct URL you’ll cite later.
- Extract or convert the data. Convert GML to GeoJSON, or fetch the relevant features directly via WFS if the municipality publishes one.
- Set your styling rules. Apply SVBP colours for enkelbestemming, add hatching or a distinct outline for dubbelbestemmingen, and label height notations clearly rather than burying them in a pop-up only.
- Add context. Overlay the plan on an aerial photo or existing 3D building layer so viewers can orient themselves against real streets and structures, not an empty canvas.
- Annotate, cite and publish. Add a legend, the data extraction date, and a working link to the official planregels before the visual goes anywhere near a stakeholder or public meeting.
Pro Tip: Automating steps 2 and 3 pays off fast if you handle more than a handful of plans a year. Parsing height and dubbelbestemming attributes into consistent visual rules once means every future massing model follows the same logic, rather than being restyled by hand each time.
Best practices for clarity, accuracy and public communication
A visual that looks authoritative but omits its source invites disputes later, especially once a plan is amended and your graphic quietly becomes outdated. A few habits keep outputs both accurate and genuinely useful to non-specialists:
- Always show a clear legend, the data date, and a direct link to the official planregels on the same graphic, not in a separate document
- Include existing buildings, streets and aerial imagery so residents and council members can immediately locate themselves on the map
- In 3D massing, keep detail limited to what the plan actually regulates. A photorealistic render of a building that hasn’t been designed yet risks being read as the finished proposal rather than the legal envelope
- Record the source system (Ruimtelijkeplannen.nl, PDOK, or a specific municipal WFS) and the extraction date on every graphic you publish, even internal drafts
Research into digital zoning plan review backs this up: interactivity such as click-to-reveal pop-ups improves comprehension, but only when the information shown per click stays limited and specific rather than dumping the entire planregels text on the viewer.
A planner’s view: from screening to a stakeholder-ready visual
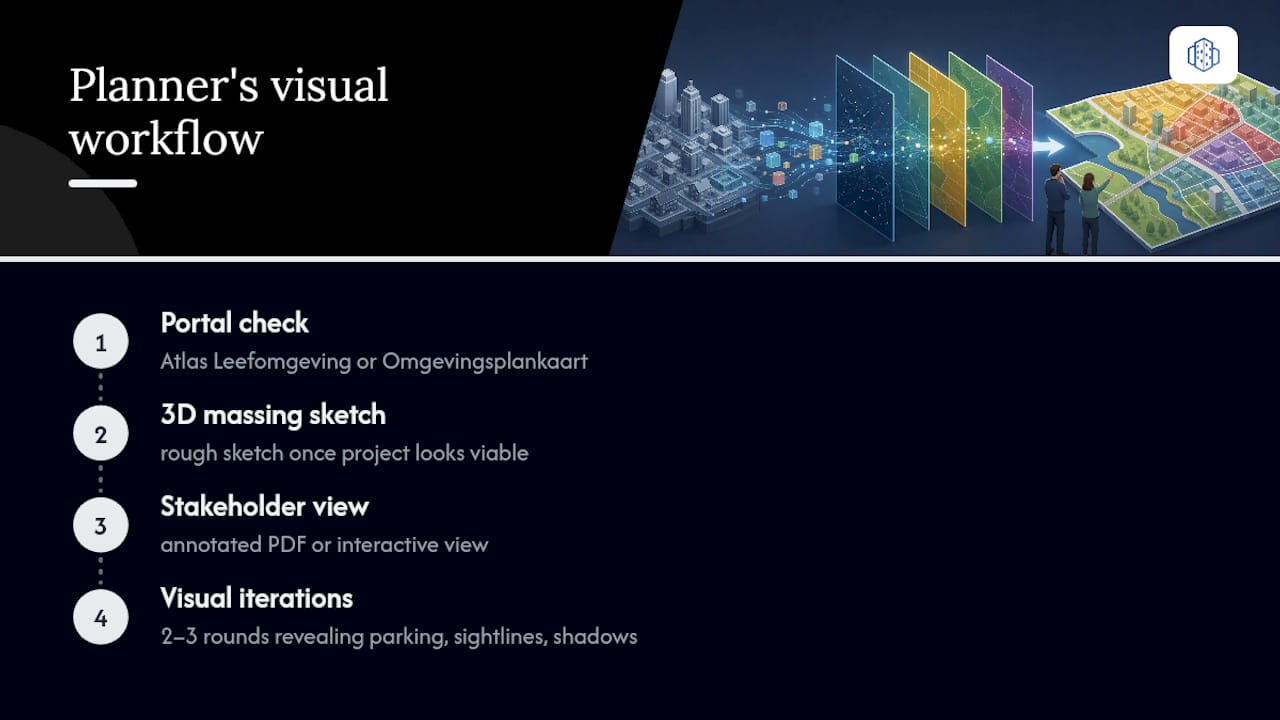
A typical workflow looks like this: a quick portal check on Atlas Leefomgeving or Omgevingsplankaart to confirm the bestemming, followed by a rough 3D massing sketch once the project looks viable, then an annotated PDF or interactive view for the stakeholder session. That sequence tends to cut the number of clarifying questions in a first council presentation, because height and orientation are visible rather than described in text.
Most projects need two to three visual iterations before approval, largely because the first version reveals which layers residents or council members actually ask about, whether that’s parking capacity, sightlines or shadow on a neighbouring garden.
— Anne Dullemond
How 3D Cityplanner supports this workflow
Manually converting GML, styling dubbelbestemmingen and building a 3D massing model by hand takes real GIS skill and real time. 3D Cityplanner is built to shortcut that: it pulls PDOK and WMS layers directly into a browser environment, generates parametric building massing from your plan attributes, and runs sunlight and visibility checks without any desktop GIS installation.
For a feasibility study or a redevelopment scenario, that means going from official plan data to a stakeholder-ready 3D comparison in one platform rather than stitching together GIS software, a rendering tool and a slide deck. Municipalities and consultancies can start with a gebiedsscan to see the platform applied to a real site, or review current pricing to compare the Starter plan at €79 per month against the Professional and Team tiers for larger project teams. If you’re weighing up whether a browser-based digital twin fits your next zoning project, requesting a demo is the most direct next step.
Sources
Most bestemmingsplan data in the Netherlands flows through PDOK and the Nationaal Geo Register, which expose national and municipal datasets as WMS and WFS services. WMS gives you a rendered image layer, useful for a quick visual overlay; WFS gives you the underlying vector features, which you need if you want to restyle, query or extract attributes.
The original verbeelding is typically published as GML, the standard geographic format for Dutch planning data. Most web-based viewers and 3D tools work more efficiently with GeoJSON, so converting GML to GeoJSON is a near-universal first step before building anything interactive.
A few practical points worth knowing before you start parsing:
- Omgevingswet — rules on the map / terms use
- 3D visualization of zoning plans — Data Overheid (Groningen case study)
- Atlas Leefomgeving — Bestemmingsplannen
- Maps Amsterdam — Bestemmingsplannen
- Omgevingsplankaart — Bestemmingsplan op adres
Getting this parsing step right is what separates a rough sketch from a massing model planners can actually trust for feasibility work.
FAQ
Can I view a bestemmingsplan for free?
Yes. Ruimtelijkeplannen.nl, the Omgevingsloket, and portals such as Atlas Leefomgeving and Omgevingsplankaart are all free to browse and search by address.
Where can I find bestemmingsplannen for the whole of the Netherlands?
Ruimtelijkeplannen.nl and the Omgevingsloket cover the whole country and are the only sources that carry legal weight for planregels. Nationwide map portals like Atlas Leefomgeving and Omgevingsplankaart are useful for quick screening but should be cross-checked against the official register before you cite a rule.
How do I find out the bestemming of a specific plot?
Search the address or postcode on Omgevingsplankaart, Bestemmingsplan-inzien or a municipal viewer such as Maps Amsterdam to see the enkelbestemming instantly. For a legally reliable answer, confirm the same plot on Ruimtelijkeplannen.nl or the Omgevingsloket, since third-party portals can lag behind recent plan amendments.
What is the difference between enkelbestemming and dubbelbestemming?
An enkelbestemming is the primary zoning designation for a plot, such as “Wonen” or “Bedrijf”. A dubbelbestemming is an overlapping designation, like an archaeology or water defence zone, that adds extra rules on top of the primary bestemming and often needs separate attention when visualising a plan.
Can 3D Cityplanner help visualise a bestemmingsplan for a project?
Yes. 3D Cityplanner connects to PDOK and WMS data to generate 3D massing directly from plan attributes, along with sunlight and visibility checks useful for feasibility studies and stakeholder presentations. Current plans and pricing are listed on the 3D Cityplanner pricing page.