10 Million Dutch Buildings: Which BAG 3D Model Settings Planners Need
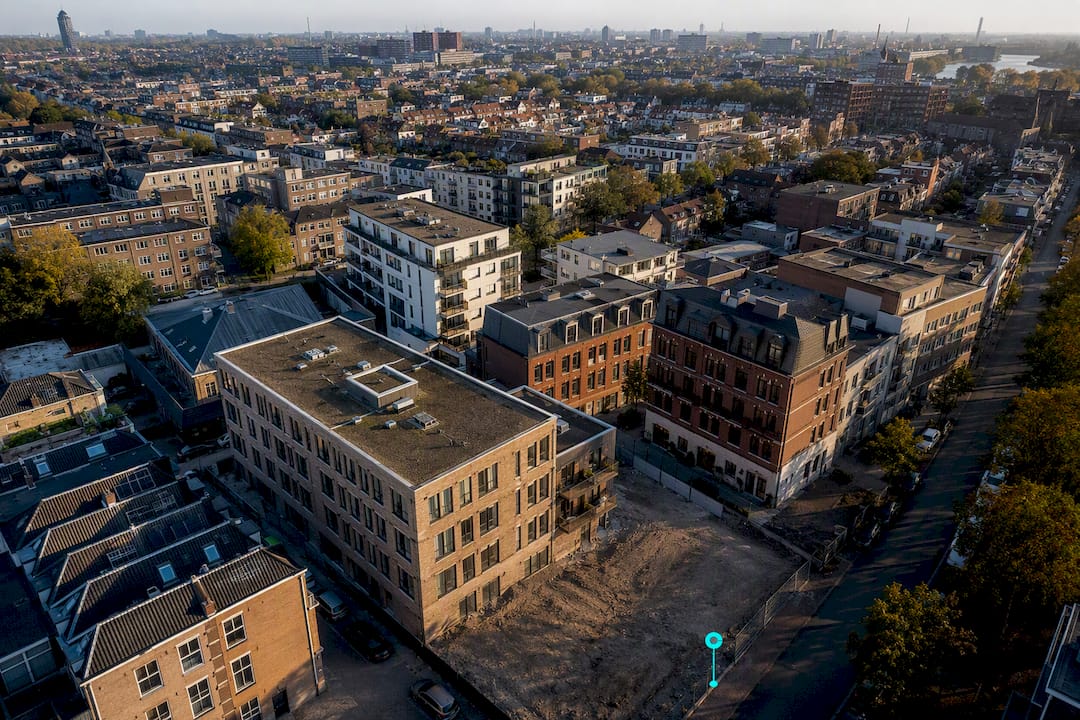
For urban planners in the Netherlands, a bag 3d model usually means one thing: 3DBAG, the national dataset of reconstructed 3D building models built from the BAG and AHN. It is open data, ready for sunlight, noise and massing studies, and maintained by TU Delft’s 3D Geoinformation group with distribution through PDOK and Kadaster.
TL;DR:3DBAG provides reconstructed 3D building models with detailed roof shapes and height percentiles, unlike the flat-footprint BAG data.Accuracy varies depending on AHN elevation data used and the chosen height percentile, with typical RMSE suitable for GIS-scale analyses.LoD1 models support rough massing studies, while LoD2 is essential for solar, shadow, and detailed urban design analysis.The dataset updates monthly and is freely available under a Creative Commons license, with metadata indicating its currency and data quality.Most GIS and urban planning platforms, including 3D Cityplanner, can directly import CityJSON and WFS outputs, streamlining scenario and stakeholder assessments.
Table of Contents
- What is a bag 3d model, and how does it differ from the BAG?
- Levels of detail and model quality: what LoD1 and LoD2 actually give you
- Access, licensing and update cadence
- Matching planning tasks to the right LoD and attributes
- Bringing 3DBAG into your GIS and digital twin workflow
- Getting started checklist for a 3DBAG project
- What planners consistently get wrong about 3DBAG
- How 3D Cityplanner helps you put 3DBAG to work
- Sources
- FAQ
What is a bag 3d model, and how does it differ from the BAG?
The BAG, or Basisregistratie Adressen en Gebouwen, is the Netherlands’ official administrative register of addresses and buildings. It records footprints, construction years, and status flags in two dimensions, and municipalities use it as the legal source for property administration. Kadaster maintains the BAG as the authoritative register, and every 3D building model produced for the country ultimately traces its footprint geometry back to this source.
3DBAG is a different product entirely. It takes each BAG footprint and reconstructs a solid 3D shape above it, using elevation data to model roof form and height. TU Delft’s 3D Geoinformation group develops the automated pipeline and publishes the results as a nationwide dataset with monthly refreshes, distributed through PDOK.
That distinction matters for planning work because BAG alone tells you nothing about height, roof shape, or massing. Practitioner guidance is blunt about this: assuming BAG geometry behaves like a 3D model is one of the most common mistakes teams make when they first bring the data into a GIS project.
3DBAG’s principal attributes include:
- Building height at multiple reference percentiles, not a single value
- Roof shape classification derived from elevation data
- A reconstructed 3D solid per building, linked to its BAG identifier
- Quality indicators, including RMSE and the AHN version used for that building
Levels of detail and model quality: what LoD1 and LoD2 actually give you
LoD1 gives you a flat-roofed extrusion: a footprint pushed up to a single height. It is fast, small in file size, and entirely adequate for tasks that only need rough massing, such as a first-pass capacity study or a coarse noise propagation model. LoD2 adds roof geometry: pitched roofs, dormers, and other shape detail that matters the moment sunlight, solar potential, or visual impact enters the analysis. Some releases also reference LoD1.3, an intermediate variant with a flat roof set at a more representative height than a simple footprint extrusion.
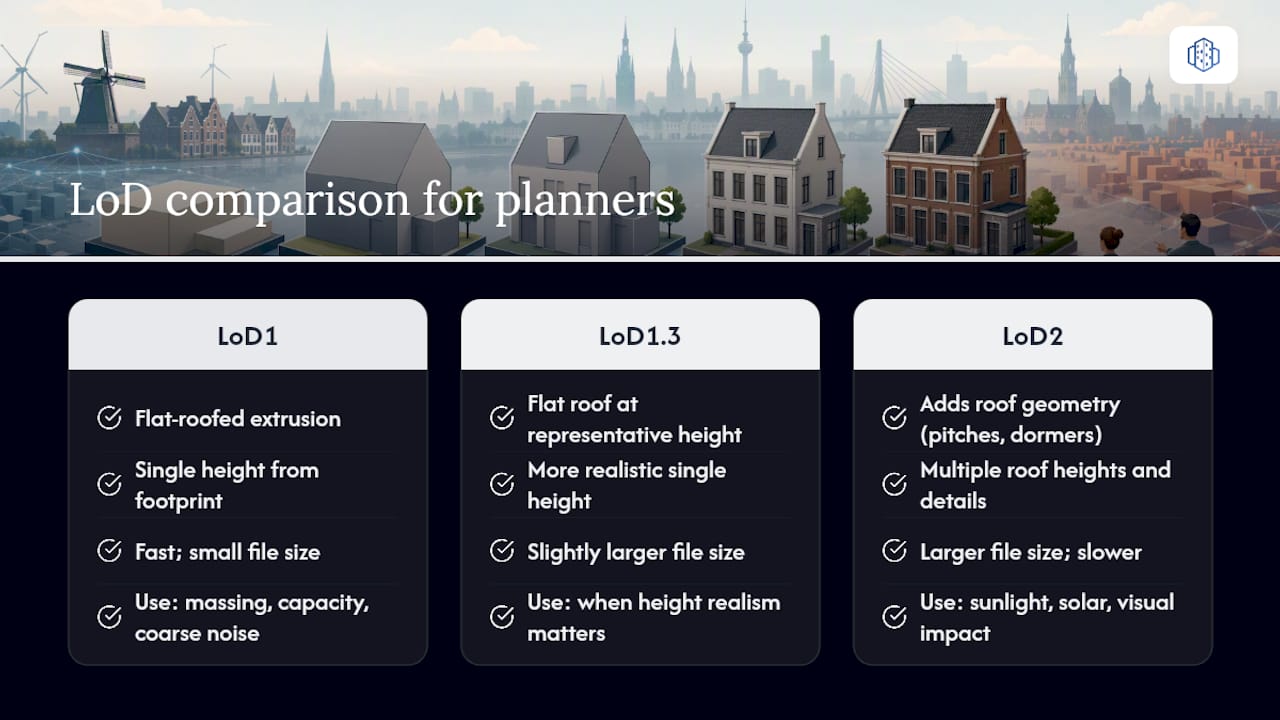
Height itself is not a single number per building. TU Delft’s methodology generates eight reference-height percentiles for every building, so planners can pick the value that suits their analysis rather than accepting one arbitrary figure.
Reported accuracy for the flat-roof case has a root mean square error (RMSE) generally considered precise enough for most GIS-scale analysis, according to TU Delft’s own methodology paper. That is precise enough for most GIS-scale analysis, though it is not survey-grade. Always check the AHN version attribute in a building’s metadata: older AHN2 coverage in some tiles can behave differently from AHN3, and mixing versions across a study area without noticing is an easy way to introduce inconsistent height errors.
Access, licensing and update cadence
Getting 3DBAG data into a project takes a handful of predictable steps.
- Start at the 3DBAG viewer to confirm coverage and check that your area of interest looks sensible before downloading anything.
- Query the PDOK WFS endpoint for a targeted subset, or pull a full-tile CityJSON download if you need broader coverage.
- Choose the real-coordinates CityJSON variant if your GIS or digital twin platform expects true map coordinates rather than a local origin.
- Record the licence terms and attribution wording alongside the download, before the file gets buried in a project folder.
3DBAG data is released under a Creative Commons Attribution licence, which permits reuse, redistribution, and commercial application provided the source is credited. Good attribution practice means naming TU Delft’s 3D Geoinformation group and the dataset version in any published map, report, or stakeholder deck built on the data.
The dataset refreshes monthly, and each release carries metadata fields showing the BAG timestamp and AHN version used, so a planning team can tell at a glance how current their extract is.
Matching planning tasks to the right LoD and attributes
Different planning questions call for different slices of the dataset, and picking the wrong one wastes analysis time later.
- Wind and noise modelling generally works fine with LoD1 and a ground-level reference height, since airflow and sound propagation care more about massing than roof detail.
- Sunlight and solar potential studies need LoD2, because roof pitch and orientation directly change how much usable roof area receives direct light.
- Energy modelling benefits from the height percentiles, since building volume estimates feed heat-loss and demand calculations.
- Green roof potential depends on roof shape attributes from LoD2, since a steeply pitched roof rules out most green roof options that a flat one would support.
Two quick examples show this in practice. A noise buffer study along a proposed ring road corridor can run on LoD1 massing alone, since the analysis cares about building bulk blocking sound, not roof detail. A courtyard sunlight study for a redevelopment site at midday needs LoD2, because the surrounding roofline shapes exactly where shadows fall across the courtyard through the day.
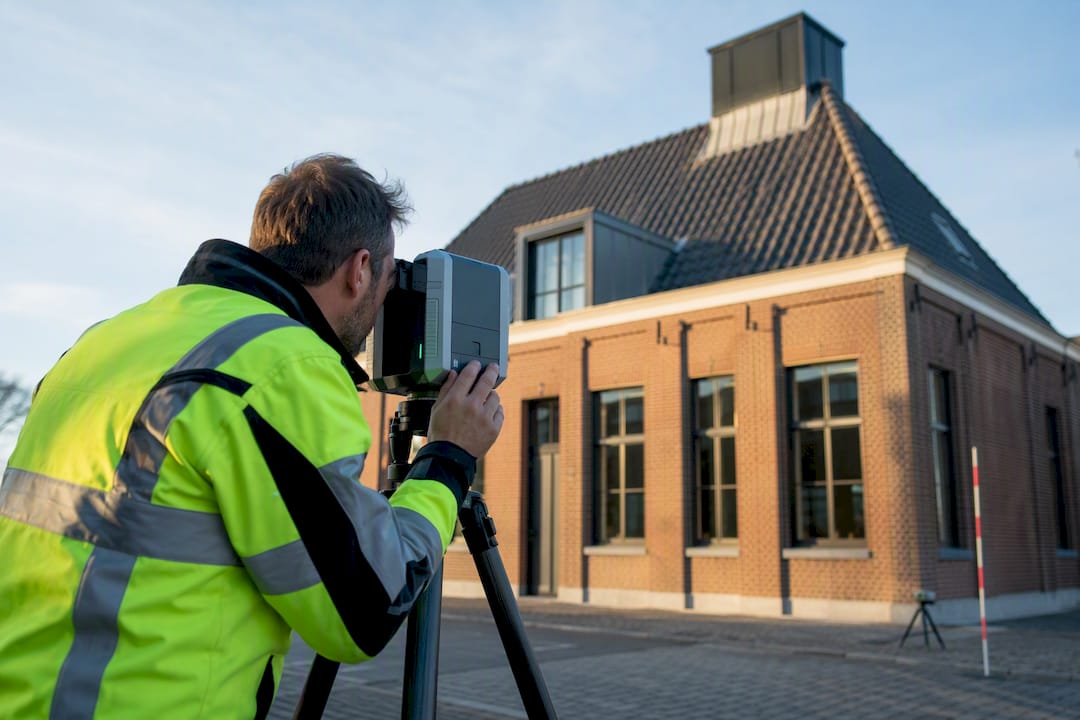
For anything regulatory or safety-critical, local survey data or targeted LiDAR capture should still validate the automated reconstruction before it informs a final decision.
Bringing 3DBAG into your GIS and digital twin workflow
Getting from a raw download to a usable scenario model follows a consistent sequence.
- Define the project scope: municipality boundary, neighbourhood, or a single redevelopment parcel.
- Download the relevant subset through PDOK’s WFS endpoint or a tiled CityJSON export.
- Check the metadata for BAG timestamp, AHN version, and quality flags before proceeding.
- Convert coordinate reference systems or formats as needed for your target platform.
- Run a quick validation, comparing a handful of building heights against known ground truth or aerial imagery.
- Import the validated model into your planning or visualisation platform.
Common conversions involve moving CityJSON into formats that desktop GIS tools or 3D engines accept more readily, and most mainstream platforms now support CityJSON or WFS ingestion directly, which removes a step that used to require manual format wrangling.
Some platforms accept CityJSON and WFS outputs directly, allowing planning teams to bring 3DBAG-derived building models into scenario comparison without manual conversion. Once imported, the building geometry can support sunlight studies, massing comparisons, and stakeholder walkthroughs within a browser-based environment. A practical walkthrough of the conversion and import steps is covered in this 3D building modelling tutorial.
Getting started checklist for a 3DBAG project
Before pulling any data, fix the following in order:
- State the planning goal, since it determines which LoD and height percentile you need.
- Choose LoD1 or LoD2 based on that goal, plus the reference height percentile.
- Download the relevant tile or WFS subset for your study area.
- Check the AHN version and quality flags attached to each building.
- Convert coordinate systems or file formats for your target software.
- Run a small validation against a handful of known buildings.
- Record the licence terms, attribution text, and the dataset’s update date for your project file.
A common pitfall is skipping the validation step and discovering height anomalies only after a report has gone to stakeholders. Ten minutes checking a sample against aerial imagery avoids that entirely.
What planners consistently get wrong about 3DBAG
The most frequent error is not technical. It is assuming a 3D model equals ground truth simply because it comes from a government-adjacent source. 3DBAG is automatically reconstructed, and the open-source 3dfier pipeline behind it is transparent precisely so practitioners can question its outputs where local conditions demand it.
Stakeholder presentations go better when you show the percentile choice openly rather than hiding it behind a single “height” label. And any regulatory-facing analysis deserves a local check before it leaves the office.
— Anne Dullemond
How 3D Cityplanner helps you put 3DBAG to work
Some platforms provide a faster path from downloaded datasets to decision-ready scenarios than assembling separate GIS, visualisation, and reporting tools. They can ingest CityJSON and WFS outputs directly, allowing a 3DBAG extract to move into scenario comparison, sunlight analysis, and visibility studies without a manual conversion pipeline.
That matters most in the early stages of a project, when a municipality or development team needs to compare massing options or test a redevelopment scenario against sunlight and visibility constraints before committing budget to a full feasibility study. Browser-based platforms allow planning colleagues and external stakeholders to view the same model without installing desktop GIS software, which can smooth out stakeholder review sessions considerably.
If you are weighing up how a specific site would perform under different building envelopes, the urban design platform is the natural starting point, and a free trial lets you bring your own 3DBAG extract in and test the workflow on a real project before deciding whether it fits your team.
Sources
3DBAG combines two raw inputs. The BAG pand-actueelbestand supplies current building footprints and identifiers, while the AHN (Actueel Hoogtebestand Nederland) supplies elevation data as a point cloud or raster. The pipeline has moved through successive AHN versions, AHN2 and AHN3 among them, and each building record in 3DBAG carries a note on which AHN version generated its height values.
PDOK, the Dutch government’s spatial data portal, is where most planners will actually touch the data. It hosts:
CityJSON has become the practical standard here. It is a lightweight JSON-based format built specifically for 3D city models, and it exchanges cleanly with GIS software and web viewers without the overhead of older CityGML files. The CityJSON project’s own announcement confirmed that all ten million Dutch buildings became available in LoD2 CityJSON, a release that made whole-country reuse genuinely practical for the first time. Full documentation, including schema notes and use-case guidance, sits on the 3DBAG docs site.
FAQ
What does “bag 3d model” mean in a Dutch planning context?
It refers to 3DBAG, the national dataset of reconstructed 3D building models derived from the BAG register and AHN elevation data, published by TU Delft and distributed through PDOK.
Is 3DBAG data free to use?
Yes. It is released under a Creative Commons Attribution licence, which permits reuse and commercial application provided the source is credited.
Should I use LoD1 or LoD2 for a sunlight study?
Use LoD2, since roof pitch and shape directly affect how sunlight and shadow fall across a site, unlike LoD1’s flat extrusion.
How accurate is the 3DBAG height data?
Typical accuracy for flat-roof buildings at the 75th percentile has a RMSE considered precise enough for most GIS-scale planning analysis but is not a substitute for survey-grade measurement.
How often is 3DBAG updated?
The dataset refreshes monthly, with metadata on each building record showing the BAG timestamp and AHN version used in that update.
Can I import 3DBAG data into 3D Cityplanner?
Yes, 3D Cityplanner accepts CityJSON and WFS inputs directly, so a 3DBAG extract can move into scenario comparison and visibility or sunlight analysis without manual conversion.
Recommended
- 3d Building Modeling Tutorial for Efficient Urban Planning – 3D Urban Development
- 3D City Models: 30+ EU Cities Use CityGML Standard – 3D Urban Development
- Top 3D architecture model examples for urban design – 3D Urban Development
- Dutch Ladder for Sustainable Urbanization: Prove Need with 3D Digital Twins


